
Global Broker Regulation Inquiry App
About WikiFX
English
简体中文
繁體中文
English
Pусский
日本語
ภาษาไทย
Tiếng Việt
Bahasa Indonesia
Español
हिन्दी
Filippiiniläinen
Français
Deutsch
Português
Türkçe
한국어
العربية
اردو
FXCG - Gold(XAU/USD)- Forex Trading Analysis(15/04/2026)
Abstract:I. Market OverviewThe gold market (XAU/USD) extended its strong bullish momentum into April 15, driven by two core catalysts: persistent safe-haven demand amid escalating geopolitical tensions between
I. Market Overview
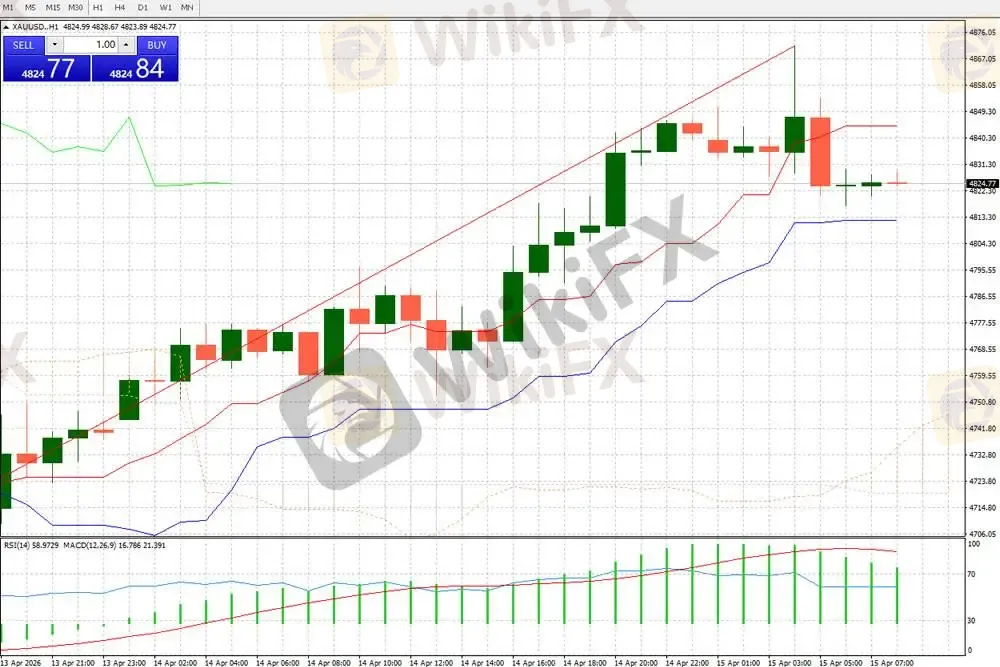
The gold market (XAU/USD) extended its strong bullish momentum into April 15, driven by two core catalysts: persistent safe-haven demand amid escalating geopolitical tensions between the U.S. and Iran, and a weaker U.S. Dollar Index, which fell to a six-week low, coupled with growing market expectations for Federal Reserve rate cuts. As of writing, spot gold is trading in a range of $4820-$4830 per ounce, with an intraday high of $4870.65 and a low of $4816.36, undergoing a technical correction after hitting a fresh multi-year high.
II. 1-Hour Technical Deep Dive
1. Trend and Structure
From the 1-hour chart, gold has maintained a clear uptrend along an ascending trendline, with consecutive higher highs and higher lows confirming the medium-term bullish structure. However, after reaching the near-term high around $4870, a large bearish candlestick broke the unilateral rally, pushing the price into a high-level consolidation phase.
Trend Assessment: The broader bullish trend remains intact, but the short-term cycle has entered a technical pullback, which is a normal correction within an uptrend, not a trend reversal.
Channel and Moving Averages: The price has retreated to the Bollinger Bands middle line, with the bands still in an upward opening structure, and the middle line at $4810-$4820 acting as dynamic support. The lower edge of the ascending trendline, at the psychological $4800 level, is the key defense for the current bull trend.
2. Indicator Signals
RSI (Relative Strength Index): The RSI currently stands at ~58.97, pulling back from the overbought zone (above 70) to a neutral-bullish range, indicating a reduction in short-term bullish momentum and a release of overbought pressure, creating room for a potential second leg higher.
MACD (Moving Average Convergence Divergence): The MACD lines have turned lower at highs, with the histogram bars shrinking significantly, forming a clear bearish divergence (price made a new high while the indicator failed to follow), confirming the short-term technical correction. The momentum is weakening but has not yet formed a death cross, requiring further observation.
Bollinger Bands: The price pulled back from the upper band to test the middle line support, with the upper band resistance at $4860-$4870 and the lower band support at $4790-$4800, confirming a range-bound pattern.
3. Key Support and Resistance Levels
Resistance: First resistance at $4840-$4850 (intraday rebound pressure), second resistance at $4870 (intraday high), strong resistance at the psychological $4900 level.
Support: First support at $4820-$4830 (current consolidation range), second support at $4800 (trendline + psychological strong support), strong support at $4780 (previous consolidation platform top).
III. Trading Strategy and Risk Warnings
1. Intraday Trading Plan
Gold is currently in a high-level consolidation with an intact bullish trend. The trading strategy should prioritize "buy on dips, with short positions as a supplement", avoiding chasing prices at highs:
Long Positions: If the price stabilizes in the $4810-$4820 range, enter long positions with a stop-loss below $4795, targeting $4840, $4860, and $4870 in sequence.
Short Positions: If the price rebounds to the $4860-$4870 resistance zone with confirmed overbought signals, enter short positions with a stop-loss above $4880, targeting $4830 and $4810.
Breakout Strategy: If the price breaks below $4800 effectively, the trend will weaken, and long positions should be abandoned to follow short positions; if it breaks above $4870, the bull trend will resume, and follow-through long positions can be taken, targeting $4900.
2. Key Risk Events
The U.S. March CPI data will be released at 20:30 ET today, with market expectations of 3.3% YoY headline inflation and 2.6% YoY core inflation. The data will directly impact Fed rate cut expectations:
Below-expectations CPI: Will strengthen rate cut expectations, weaken the U.S. dollar, and push gold to challenge the $4900 level;
Above-expectations CPI: Will suppress rate cut expectations, boost the U.S. dollar, and pressure gold to test the $4800 support.
In addition, continue to monitor the latest developments in U.S.-Iran geopolitics, as changes in safe-haven sentiment will directly drive short-term gold volatility.
[Disclaimer] Forex trading involves risk; please invest with caution. This content is for informational purposes and objective analysis only, and does not constitute any investment advice, basis for buying/selling, or guarantee of returns. Investors should make independent decisions based on their own financial situation and risk tolerance, and bear their own investment risks.
Disclaimer:
The views in this article only represent the author's personal views, and do not constitute investment advice on this platform. This platform does not guarantee the accuracy, completeness and timeliness of the information in the article, and will not be liable for any loss caused by the use of or reliance on the information in the article.
WikiFX Broker
Latest News
InstaForex Review 2026: Is This Forex Broker Safe?
 WikiFX
SandStoneFX Review 2026: Is This Forex Broker Safe?
WikiFXFake Investment Scam and Human Trafficking Network Busted with 109 Arrested
WikiFXFacing a 20% Floating Loss: How Beginners Can Prevent a Margin Call
WikiFXForex Traders With Day Jobs: The PERKESO Deadline You Cannot Ignore
WikiFXEMAR MARKETS Review 2026: FSCA Regulation, Withdrawal Complaints, and Account Access Risks
WikiFXMalaysia’s Pension Fund (KWAP) Hit by eFishery Fraud Scandal with RM163 Million at Risk
WikiFXMaxpro365 Review 2026: Where Is My $23,000? We Investigated User Allegations About Missing Funds
WikiFXeFishery Founder Jailed Nine Years as KWAP Defends RM163 Million Loss
WikiFXKASPER CAPITAL MARKETS Review 2026: Regulation, Safety, and User Feedback
WikiFX