
Global Broker Regulation Inquiry App
About WikiFX
English
简体中文
繁體中文
English
Pусский
日本語
ภาษาไทย
Tiếng Việt
Bahasa Indonesia
Español
हिन्दी
Filippiiniläinen
Français
Deutsch
Português
Türkçe
한국어
العربية
اردو

Harmovest Capital | Daily Report: Will Gold Keep Rising on Inflation Risks?
Abstract:13/04/2026Key HighlightsU.S. inflation remains elevatedThe 10-year U.S. Treasury yield continues to be supportedDownside in the U.S. Dollar Index appears limitedMarket ReviewU.S. Consumer Prices Rose
13/04/2026
Key Highlights
U.S. inflation remains elevated
The 10-year U.S. Treasury yield continues to be supported
Downside in the U.S. Dollar Index appears limited
Market Review
U.S. Consumer Prices Rose 3.3% in March
According to a report released by the U.S. Bureau of Labor Statistics (BLS) on Friday, consumer prices rose significantly in March, mainly driven by surging energy costs linked to the Iran conflict, pushing inflation further away from the Federal Reserves target. However, underlying inflation remained relatively moderate.
On a seasonally adjusted basis, the Consumer Price Index (CPI) increased 0.9% in March, bringing the annual inflation rate to 3.3%, largely driven by a 10.9% surge in energy costs. Both figures were in line with Dow Jones expectations. The annual inflation rate marked the highest level since April 2024, rising from 2.4% in February.
However, excluding food and energy, core inflation rose only 0.2% month-on-month and 2.6% year-on-year, both slightly below expectations by 0.1 percentage points, suggesting that underlying inflation pressures remain under control.
Some goods prices even declined during the month, including healthcare, personal care, and used vehicles.
The Iran conflict was the primary factor behind the inflation spike. BLS data showed that gasoline prices surged 21.2%, accounting for nearly three-quarters of the overall price increase.
Federal Reserve officials may therefore look past the temporary surge in energy prices and focus more on the underlying inflation trend. Over the past five years, U.S. inflation has consistently remained above the target level.
Although Fed officials hinted at a potential 25 basis point rate cut during the March meeting, the timing remains uncertain. Markets had already expected limited chances of rate cuts for the remainder of 2026. Traders reacted mildly to the report, with stock futures edging slightly higher and Treasury yields showing mixed movements.
We believe that as long as these factors persist, the Federal Reserve will likely overlook short-term energy price volatility. The Fed remains patient and has valid reasons to do so. Recent data has bought the Fed more time, but the real test still lies ahead.
Policymakers continue to closely monitor service prices, viewing them as a key indicator of underlying inflation after excluding tariff and war-related impacts.
Service prices excluding energy rose 0.2% month-on-month and 3% year-on-year. Housing prices also increased 0.3% monthly and 3% annually, matching the lowest level since August 2021.
Food prices remained unchanged for the month and rose 2.7% year-on-year, while food-at-home prices declined 0.2%. Meat prices fell 0.6%, and egg prices dropped 3.4%, bringing the annual decline to 44.7%. New vehicle prices increased slightly by 0.1%.
There are also signs that tariffs and geopolitical tensions are beginning to have an impact, with airfares rising 2.7% and apparel prices increasing 1%.
Affected Financial Instruments
U.S. Dollar
Gold
S&P 500
Summary
As U.S. inflation remains elevated, markets expect the Federal Reserve to maintain current interest rates in the near term. This supports the 10-year U.S. Treasury yield and limits downside potential in the U.S. Dollar Index, indirectly placing pressure on precious metals such as gold and silver.
Today's Key Event
U.S. Housing Sales Data
Today's market focus will be on U.S. housing sales data. As the U.S. economy shows signs of slowing and consumer spending gradually weakens, housing sales are expected to come in below market expectations.
Affected Assets
U.S. Dollar
Precious Metals (Gold, Silver, Platinum)
U.S. Equity Indices
Today's Trading Strategy
Bias: Long on Precious Metals
Market Sentiment Analysis
Fear & Greed Index
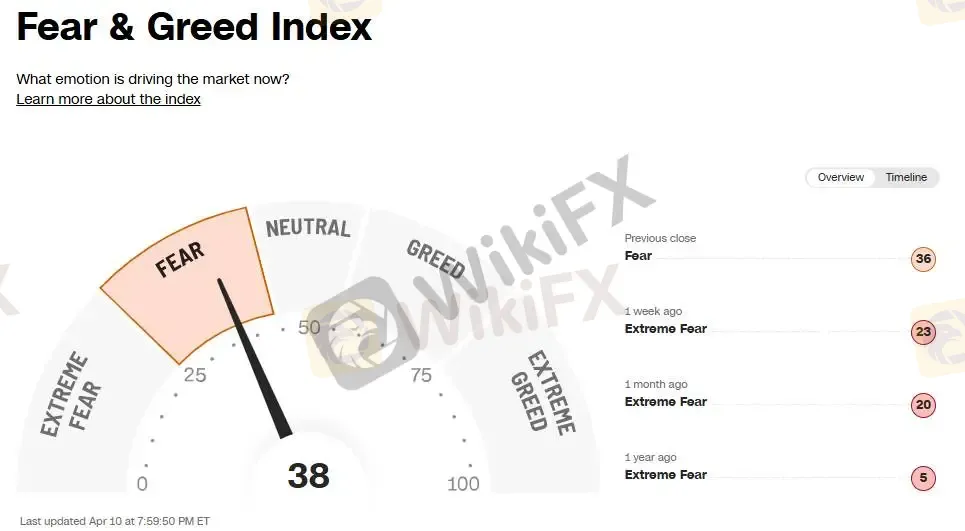
The Fear & Greed Index is a key indicator used to measure market sentiment, reflecting whether investors are driven by fear or greed. According to the latest data, the index stands at 38 (Fear), compared to the previous reading of 31, indicating that risk-off sentiment remains elevated.
The Iran conflict has significantly increased energy prices, raising concerns about persistent inflation and prompting central banks to maintain interest rates. This has gradually strengthened market demand for safe-haven assets, including gold and silver.
As risk aversion continues to rise, investors may consider positioning in:
Gold
Silver
U.S. Treasuries
Technical Analysis
XAUUSD (Gold)
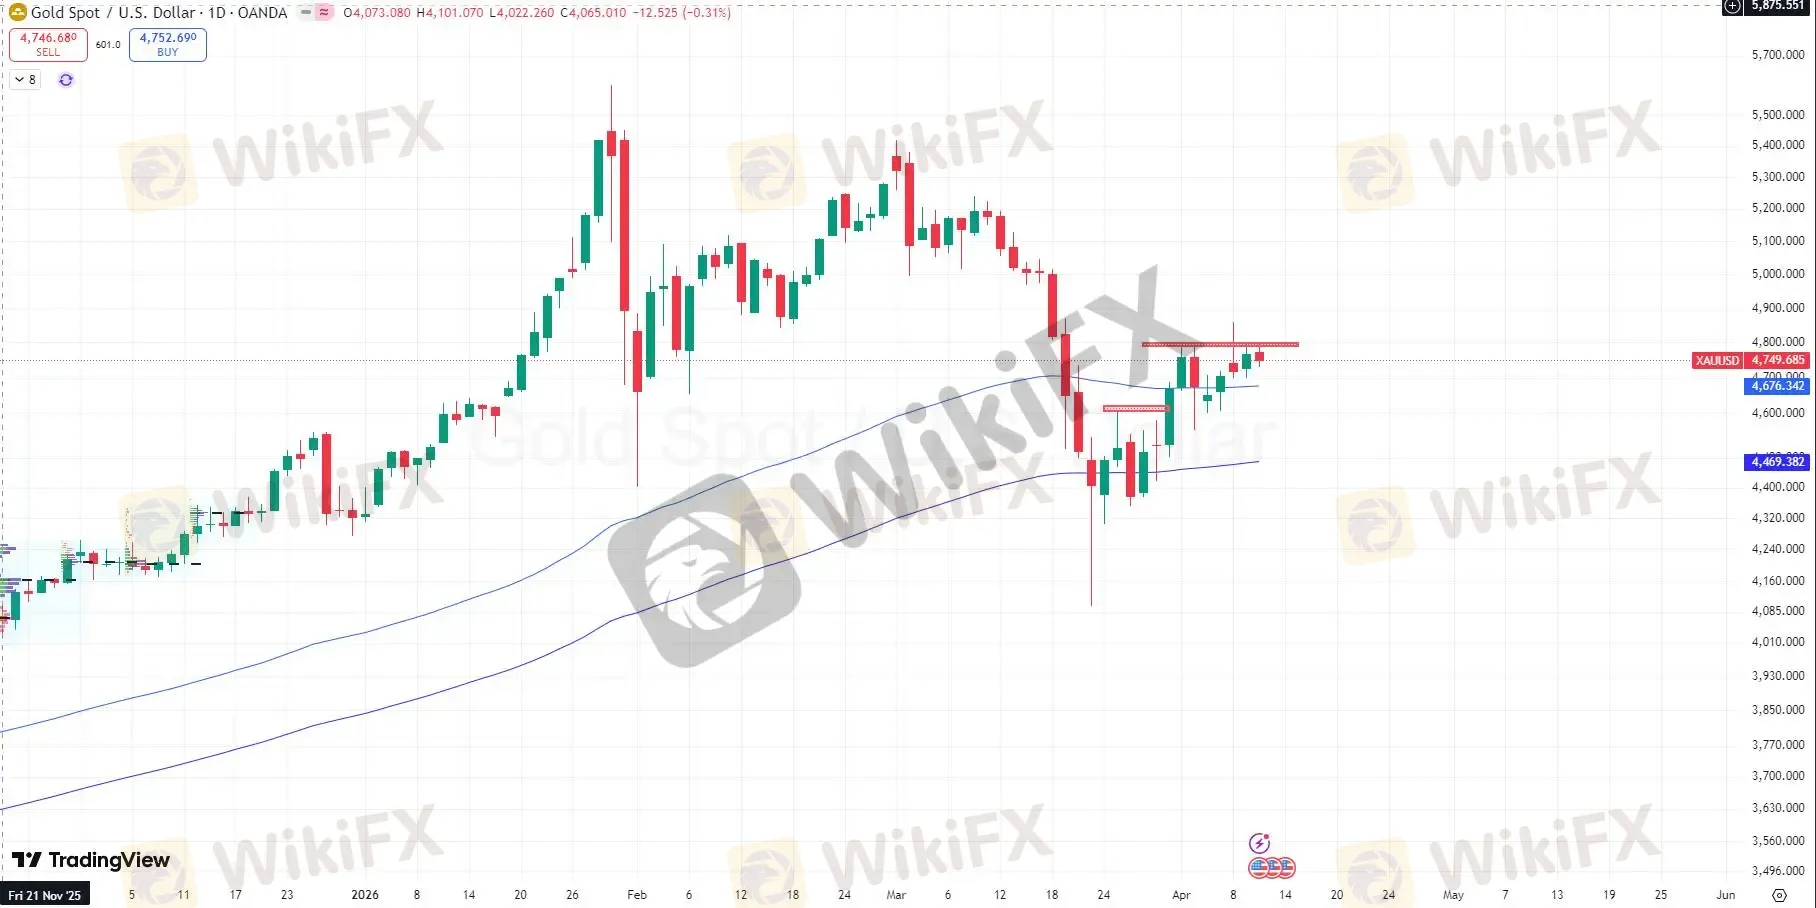
Following the announcement by U.S. President Trump of a two-week ceasefire with Iran, market risk sentiment cooled significantly. This led to a decline in the 10-year U.S. Treasury yield, indirectly supporting further upside potential in gold.
From a technical perspective, gold has successfully broken above the 4787 resistance level, indicating continued bullish momentum in the short term. Investors are advised to maintain long positions, with key support levels to monitor around 4700.
Disclaimer:
The views in this article only represent the author's personal views, and do not constitute investment advice on this platform. This platform does not guarantee the accuracy, completeness and timeliness of the information in the article, and will not be liable for any loss caused by the use of or reliance on the information in the article.
WikiFX Broker
Latest News
The Hidden Risks of Margin Calls and How to Trade Trends Safely
 WikiFX
T4Trade Review 2026: Official Warnings and Withdrawal Risks
WikiFXLONG ASIA Review 2026: Withdrawal Complaints and Unverified Regulation
WikiFXTotalFX Dangles 1:1000 Leverage and a $0 Minimum Deposit - But Is Its Regulation Strong?
WikiFXPay a 17% Tax First, Then You Can Withdraw" — How Nixse Allegedly Held One Trader's €25,000 Hostage
WikiFXHow to Read Market Reversals Through Price Action and Indicators
WikiFXA Single TikTok Ad Cost Him RM100,000
WikiFXLONG ASIA Review: Broker Complaints, Regulation Gaps, and Withdrawal Alarms
WikiFXHow Proprietary Trading and Artificial Volume Move Prices
WikiFXCrude Jumps Amid Structural FX Shifts
WikiFXCurrency Calculator
USD

CNY
Current Rate:0
Enter amount
USD
Redeemable Amount
CNY
Calculate 