

Global Broker Regulation Inquiry App
About WikiFX
English
简体中文
繁體中文
English
Pусский
日本語
ภาษาไทย
Tiếng Việt
Bahasa Indonesia
Español
हिन्दी
Filippiiniläinen
Français
Deutsch
Português
Türkçe
한국어
العربية
اردو


ETO Markets TrendWatch|2026 Midyear: AI Leads, Oil Crashes 38%, Dollar Rebounds


Abstract:Global markets moved between geopolitical risk, the AI investment boom, and shifting monetary policy during the first half of 2026.The U.S.–Iran conflict sent oil prices and inflation expectations sha
Global markets moved between geopolitical risk, the AI investment boom, and shifting monetary policy during the first half of 2026.
The U.S.–Iran conflict sent oil prices and inflation expectations sharply higher in late February. Global equities briefly lost about USD 9 trillion in market value. As tensions eased and AI demand returned, global equities recovered. Their total value ended around USD 7 trillion above year-end levels. The MSCI World Index gained nearly 10%.
Performance varied widely across assets. Oil surged before giving back most of its war premium. Precious metals fell sharply from record highs. Korean, Japanese, and U.S. technology stocks led global equities. Chinas A-share market remained resilient, while Hong Kong stocks stayed under pressure.
The dollar strengthened again. U.S. and Chinese government bonds followed very different rate paths.
Based on market performance through June 30, ETO Markets reviews the first half across commodities, equities, bonds, and currencies.
Oil: War Premium Surges, Then Collapses 38%

Oil was the most volatile major asset in the first half.
The U.S.–Iran conflict disrupted shipping through the Strait of Hormuz. Brent crude rose above USD 126 per barrel, while WTI approached USD 120.
Prices fell quickly after ceasefire talks advanced and tanker traffic resumed. Brent ended June near USD 72.92 per barrel. WTI fell to around USD 69.50.
Brent dropped 38.4% in the second quarter. WTI lost 31.5%. Strong first-quarter gains still kept both benchmarks positive for the first half.
Oil prices will now depend on shipping conditions, Irans export recovery, and OPEC+ supply policy. The extreme war premium has faded, but supply risks remain higher than before the conflict.
Gold and Silver: Higher Rates Hit Metals Hard
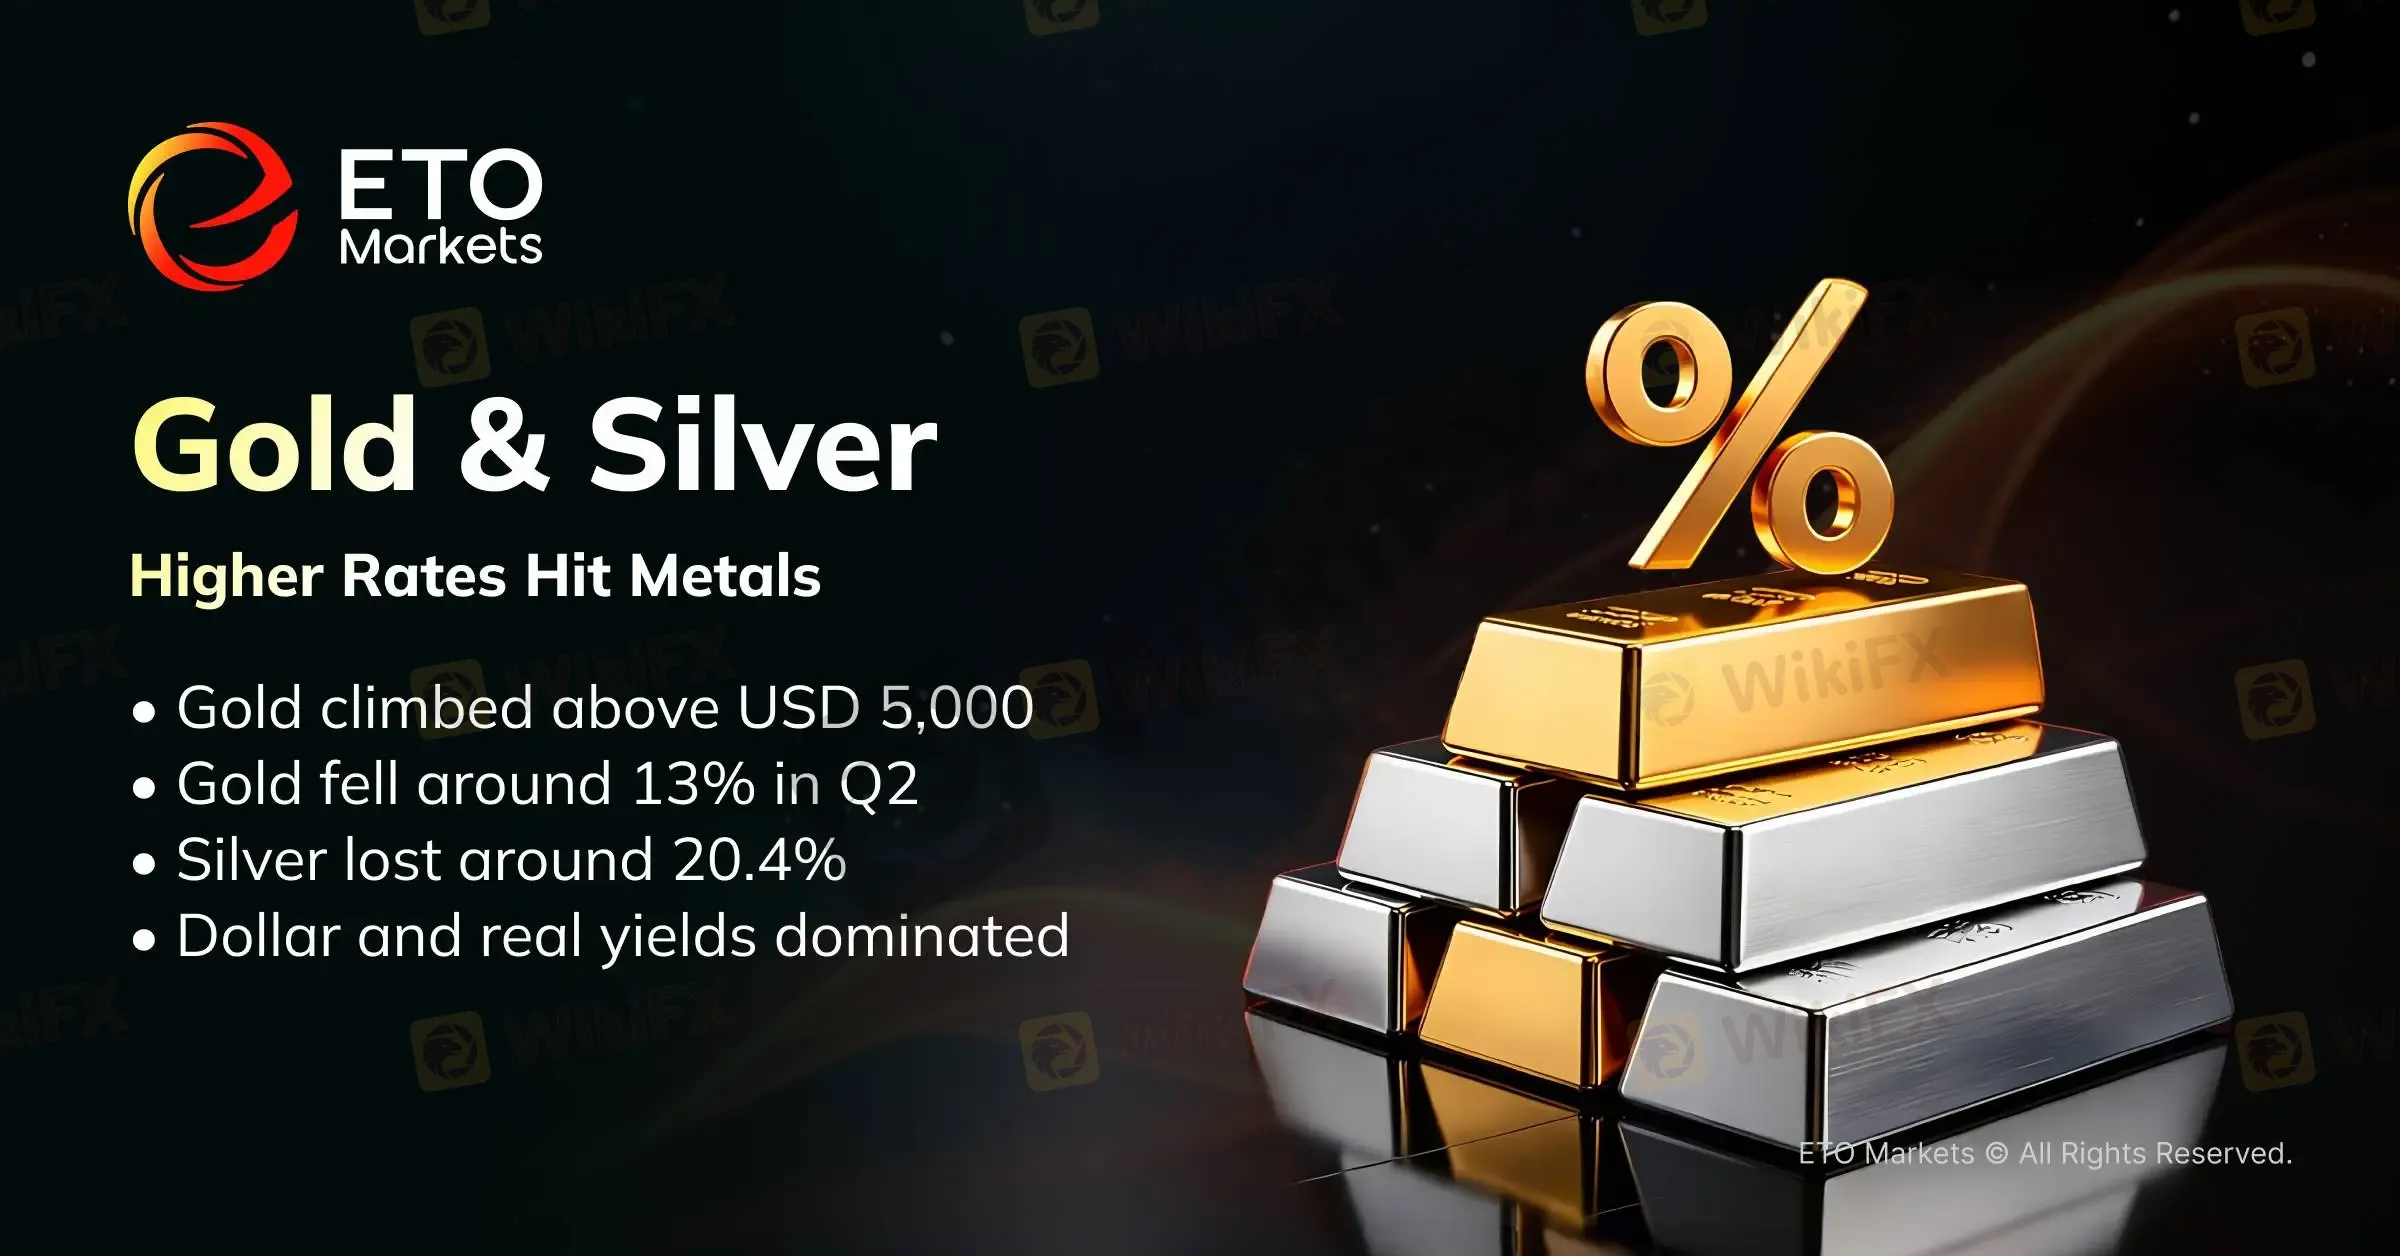
Gold extended its previous rally early in the year and moved above USD 5,000 per ounce.
The conflict then pushed oil and inflation expectations higher. Markets moved away from FED rate-cut expectations and began pricing higher rates for longer, with some investors even considering renewed rate hikes.
The dollar and real yields rose together. Gold fell about 11.2% in June and around 13% in the second quarter. It was the metals worst quarter since 2013.
Gold ended June near USD 4,027 per ounce and lost about 5% in the first half.
Central bank buying and reserve diversification remain long-term supports. In the near term, gold will stay sensitive to the dollar, real yields, and FED policy.
Silver suffered a deeper correction due to its higher volatility and stronger leverage to market liquidity.
Silver fell about 20.4% in the second quarter. It ended June near USD 59.48 per ounce and lost around 16% during the first half.
Demand from solar energy, electronics, and electrification may provide support. A stronger recovery will still require easier liquidity conditions.
U.S. Stocks: AI Drives Double-Digit Gains
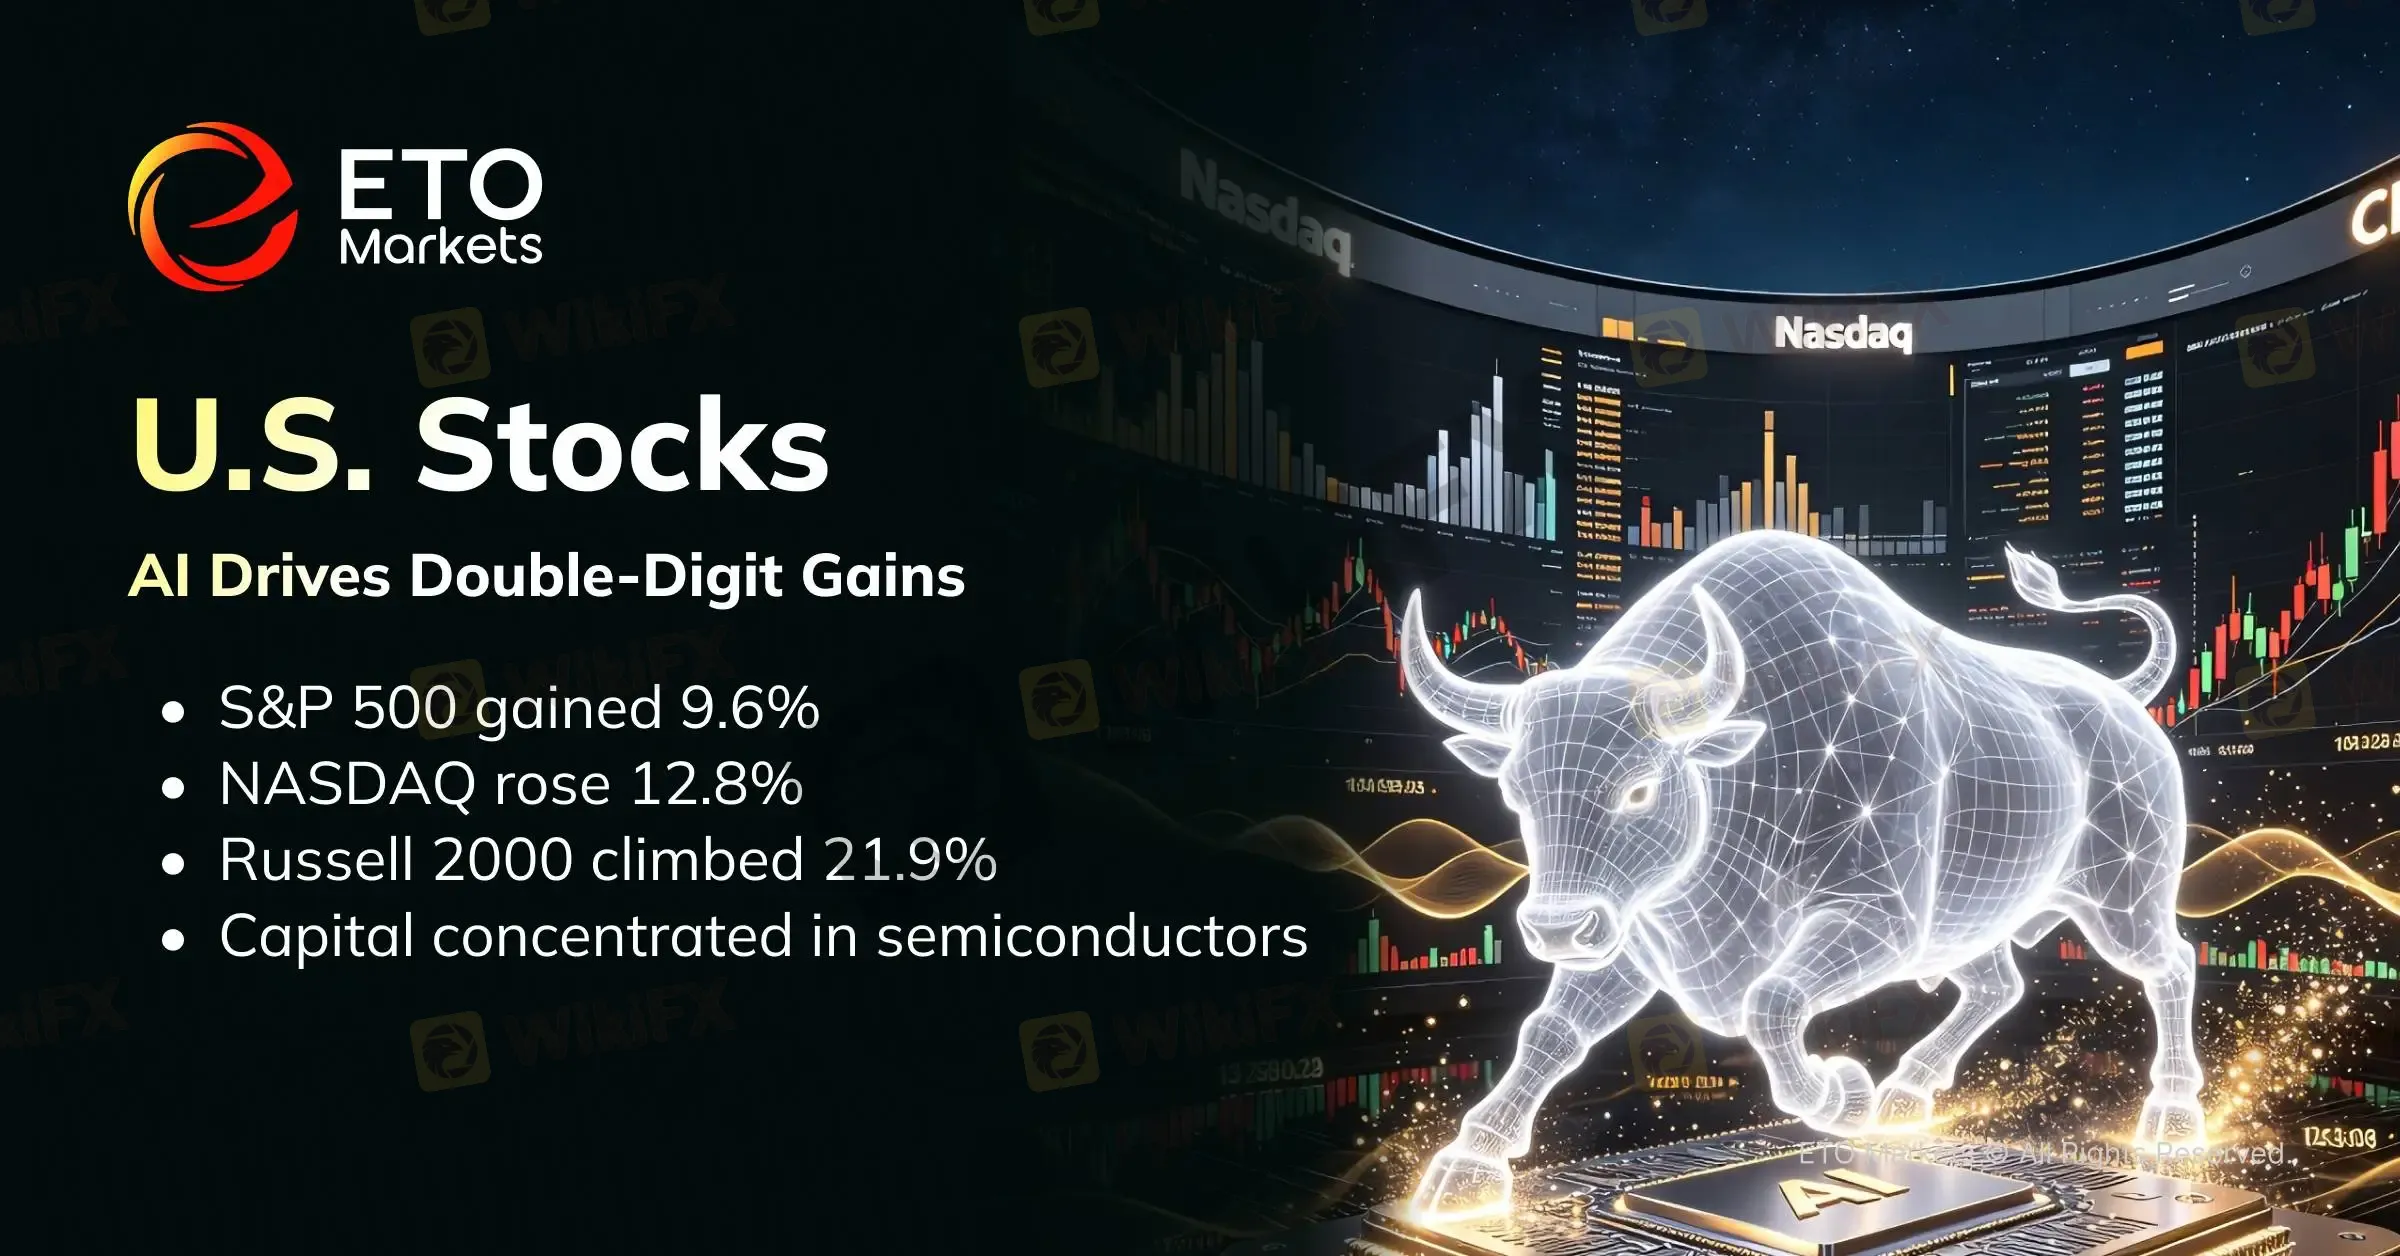
U.S. equities ended the first half higher.
The S&P 500 gained 9.6%. The NASDAQ rose 12.8%, while the Dow Jones Industrial Average added 8.9%. The Russell 2000 climbed 21.9%.
AI capital spending and semiconductor stocks remained the main drivers. The S&P 500 rose 14.9% in the second quarter. The NASDAQ gained 21.4%. Both recorded their strongest quarter since 2020.
However, the Magnificent Seven underperformed the global index as a group. Capital became more concentrated in semiconductors, AI infrastructure, and companies with clearer earnings growth.
The next phase will depend on whether AI investment produces sustained revenue and profit growth.
Second Half: FED Policy Will Decide Winners
The first half was not a simple risk-on or risk-off market. It was a broad repricing of AI, war risk, inflation, and liquidity.
ETO Markets will continue tracking FED policy, energy supply, AI investment, and global capital flows. Our cross-asset framework helps investors identify market rotation and manage concentration risk in volatile conditions.
About Us
ETO Markets is a global financial services provider headquartered in Australia, serving traders in over 120 countries worldwide. Designed for those who value speed, transparency, and capital security, ETO Markets blends advanced trading technology with access to a diverse range of asset classes, including forex, precious metal, energies, indices, stocks, cryptocurrency.
Disclaimer
The information contained herein is for general reference only and does not constitute investment advice, a solicitation, or an offer to buy or sell any financial products.
ETO Markets does not guarantee the accuracy, completeness, or timeliness of the information and shall not be liable for any losses incurred from reliance on such content.
Disclaimer:
The views in this article only represent the author's personal views, and do not constitute investment advice on this platform. This platform does not guarantee the accuracy, completeness and timeliness of the information in the article, and will not be liable for any loss caused by the use of or reliance on the information in the article.
WikiFX Broker
Latest News
EURUSD | Demand Zone Holding, Bulls Eyeing Higher Resistance
 WikiFX
Kudotrade Review 2026: Reported Slippage & Trade Execution Issues You Should Know
WikiFXEUR/USD: Bearish Structure Shift
WikiFXFxPro Opens Five CFDs To Weekend Trading
WikiFXMalaysia To Host Asia Fintech Regulatory Summit
WikiFXWeekend CFD Trading Moves Beyond Gold as Brokers Add Oil, Silver and Indices
WikiFXFX Trading Share Falls Sharply Across Retail CFD Market
WikiFXSEC Alleges $16 Million Ponzi Scheme Targeted 200 Investors
WikiFXIG Faces Hundreds Of Job Cuts In Global Restructure
WikiFXValutrades Rejects Exit Rumors Amid Client Review
WikiFX