

Global Broker Regulation Inquiry App
About WikiFX
English
简体中文
繁體中文
English
Pусский
日本語
ภาษาไทย
Tiếng Việt
Bahasa Indonesia
Español
हिन्दी
Filippiiniläinen
Français
Deutsch
Português
Türkçe
한국어
العربية
اردو


FPG USDJPY Market Report July 28, 2026


Abstract:On the H1 timeframe, USDJPY has transitioned into a higher trading range following a strong bullish breakout. As shown on the chart, the pair had previously traded sideways with support around 162.90
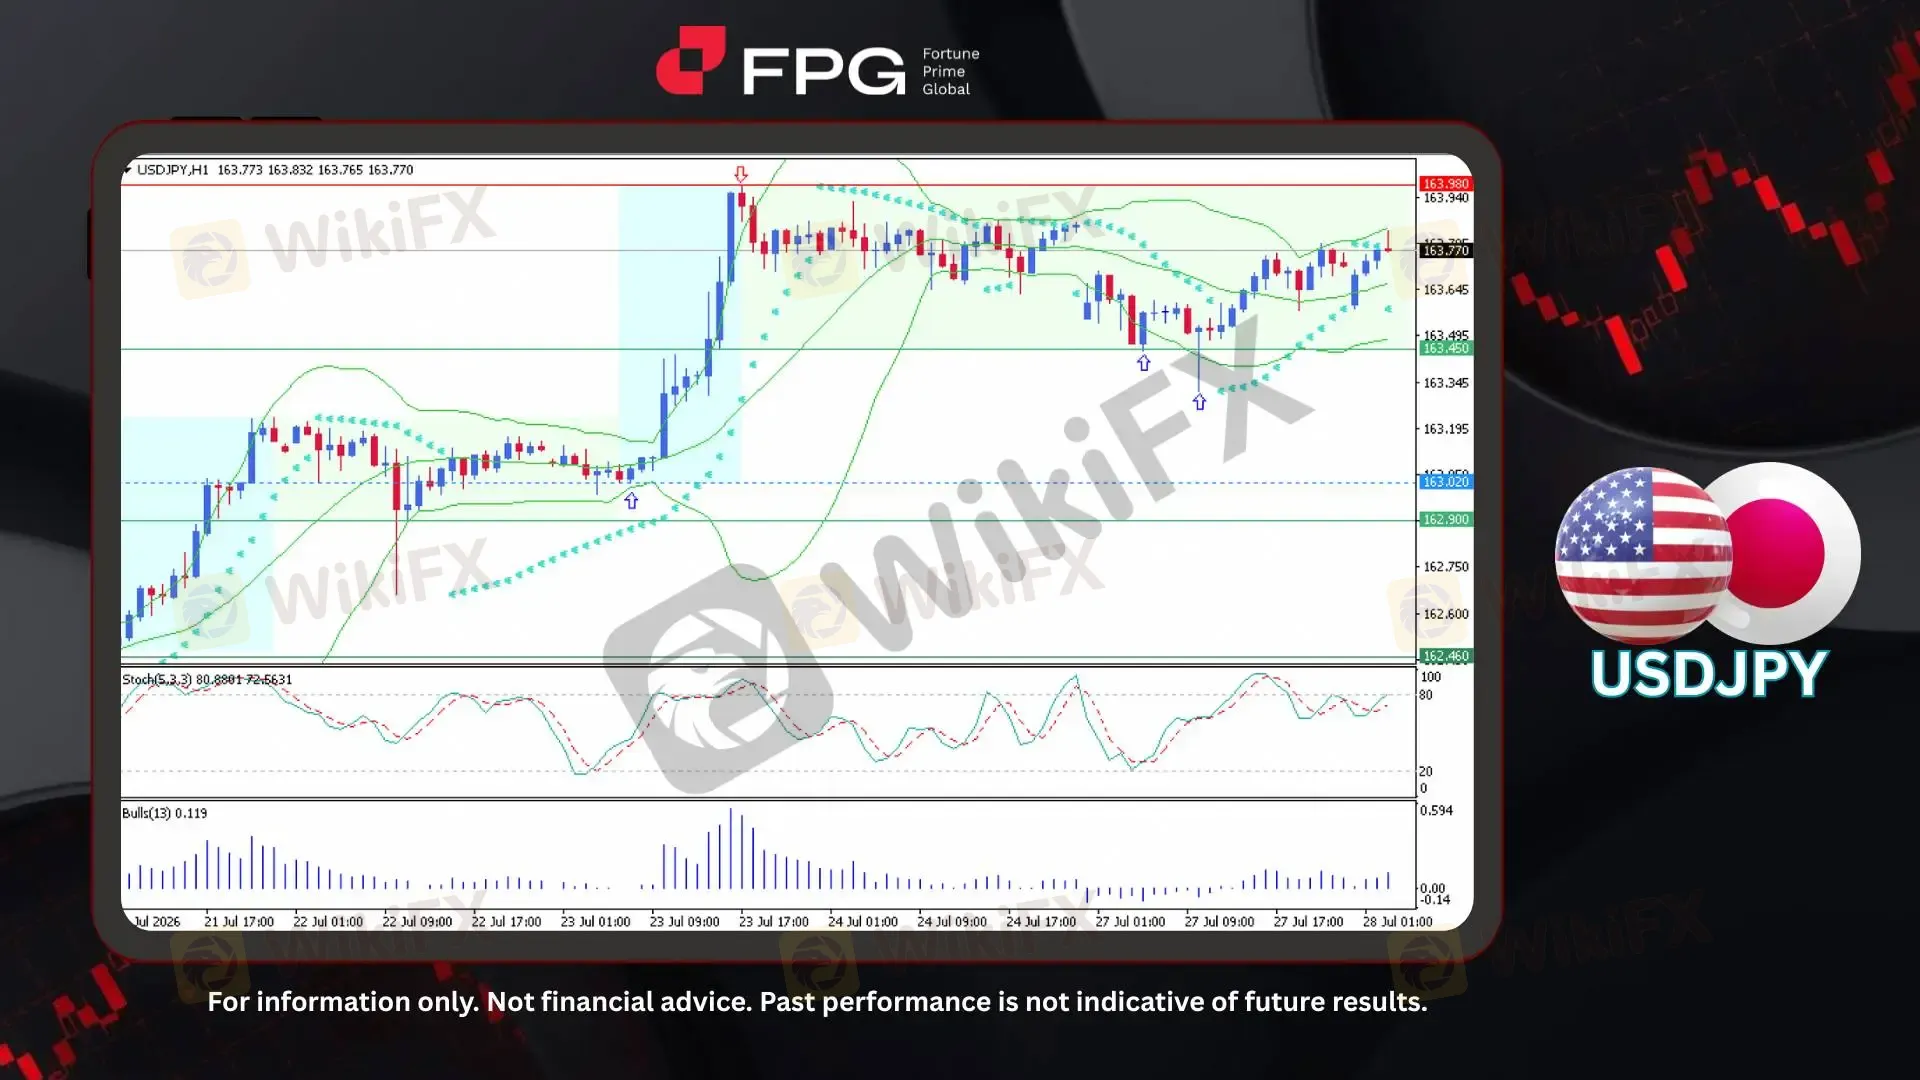
On the H1 timeframe, USDJPY has transitioned into a higher trading range following a strong bullish breakout. As shown on the chart, the pair had previously traded sideways with support around 162.90 before bullish momentum accelerated the price from approximately 163.02 to a recent high of 163.98. After reaching this peak, the rally paused, and the pair entered a consolidation phase, trading within a well-defined sideways channel. At the time of writing, USDJPY is trading near 163.77, with volatility moderating as buyers and sellers remain relatively balanced within the current range.
From a technical perspective, the Bollinger Bands remain relatively stable, suggesting that volatility has normalized following the earlier bullish expansion and that the market is currently consolidating. The latest Parabolic SAR has shifted to a single dot below the current candlestick, indicating that bullish momentum is attempting to re-establish itself after the recent pullback. Meanwhile, the Stochastic Oscillator (5,3,3) is rising at around 80.88, approaching overbought territory and reflecting sustained upward momentum, although the approach toward overbought territory could limit further gains in the near term. The Bulls Power (13) indicator remains positive at approximately 0.119, highlighting that buyers continue to hold a modest advantage despite the ongoing range-bound price action.
Market attention remains focused on the monetary policy outlook of the Bank of Japan (BOJ) and the Federal Reserve, with investors awaiting upcoming policy decisions and key economic data for further direction. While the BOJ is widely expected to maintain a cautious policy stance despite persistent inflationary pressures, the Federal Reserve continues to emphasize a data-dependent approach supported by the resilience of the U.S. economy. Fiscal and macroeconomic developments across Japan and the United States continue to shape interest rate expectations and overall market sentiment. Consequently, USDJPY is consolidating within a sideways channel after its previous bullish advance, with traders closely monitoring for a decisive breakout that could determine the pair's next directional move.
Technical Market Overview
1. Current Position: USDJPY is trading around 163.77 on the H1 timeframe, consolidating within a well-defined sideways channel after its recent bullish rally. The pair remains above its previous trading range, indicating that the broader bullish structure is still intact despite moderating volatility.
2. Resistance Zone: The nearest resistance is located at 163.98, marking the recent swing high. A sustained breakout above this level could confirm renewed bullish momentum and expose the pair to further upside.
3. Support Zone: Immediate support is seen at 163.45, followed by stronger support at 162.90. Holding above these levels would help maintain the current bullish market structure and reduce the likelihood of a deeper correction.
4. Indicator Observation: The Bollinger Bands remain relatively stable, suggesting that volatility has normalized during the consolidation phase. The latest Parabolic SAR has shifted to below the current candlestick, indicating that bullish momentum is attempting to regain control. Meanwhile, the Stochastic Oscillator (5,3,3) is rising near 80, reflecting continued upward momentum while approaching overbought territory. The Bulls Power (13) remains positive at approximately 0.119, showing that buyers continue to maintain a modest advantage.
5. Technical Summary: USDJPY remains in a short-term bullish consolidation after its recent rally, with price action continuing to trade within a sideways channel at elevated levels. As long as the pair holds above the 163.45–162.90 support zone, the broader bullish structure remains intact. A decisive break above 163.98 would strengthen the bullish outlook, whereas a break below the key support zone could signal the beginning of a deeper corrective phase. Overall, the near-term bias remains cautiously bullish, with traders awaiting a catalyst to determine the next directional breakout.
Market Performance:
Forex Last Price % Change
EUR/USD 1.1372 +0.04%
GBP/USD 1.3291 +0.03%
Key Economic Calendar:
CN: Politburo Meeting
AU: RBA Gov Bullock Speech
US: ADP Employment Change
US: Goods Trade Balance Adv
US: Retail Inventories Ex Autos MoM Adv
US: Wholesale Inventories MoM Adv
US: S&P/Case-Shiller Home Price YoY
US: CB Consumer Confidence
Risk Disclaimer: This report is for informational purposes only and does not constitute financial advice. Investments involve risks, and past performance does not guarantee future results. Consult your financial advisor for personalized investment strategies.
Disclaimer:
The views in this article only represent the author's personal views, and do not constitute investment advice on this platform. This platform does not guarantee the accuracy, completeness and timeliness of the information in the article, and will not be liable for any loss caused by the use of or reliance on the information in the article.
WikiFX Broker
Latest News
EURUSD | Demand Zone Holding, Bulls Eyeing Higher Resistance
 WikiFX
Kudotrade Review 2026: Reported Slippage & Trade Execution Issues You Should Know
WikiFXEUR/USD: Bearish Structure Shift
WikiFXFxPro Opens Five CFDs To Weekend Trading
WikiFXIG Faces Hundreds Of Job Cuts In Global Restructure
WikiFXWeekend CFD Trading Moves Beyond Gold as Brokers Add Oil, Silver and Indices
WikiFXFX Trading Share Falls Sharply Across Retail CFD Market
WikiFXSEC Alleges $16 Million Ponzi Scheme Targeted 200 Investors
WikiFXMalaysia To Host Asia Fintech Regulatory Summit
WikiFXValutrades Rejects Exit Rumors Amid Client Review
WikiFX