

Global Broker Regulation Inquiry App
About WikiFX
English
简体中文
繁體中文
English
Pусский
日本語
ภาษาไทย
Tiếng Việt
Bahasa Indonesia
Español
हिन्दी
Filippiiniläinen
Français
Deutsch
Português
Türkçe
한국어
العربية
اردو


FPG USOUSD Market Report July 27, 2026


Abstract:On the H1 timeframe, USOUSD has undergone a sharp and significant correction, declining from 93.91 to 83.48, representing a loss of approximately 11% within a relatively short period. Prior to the sel
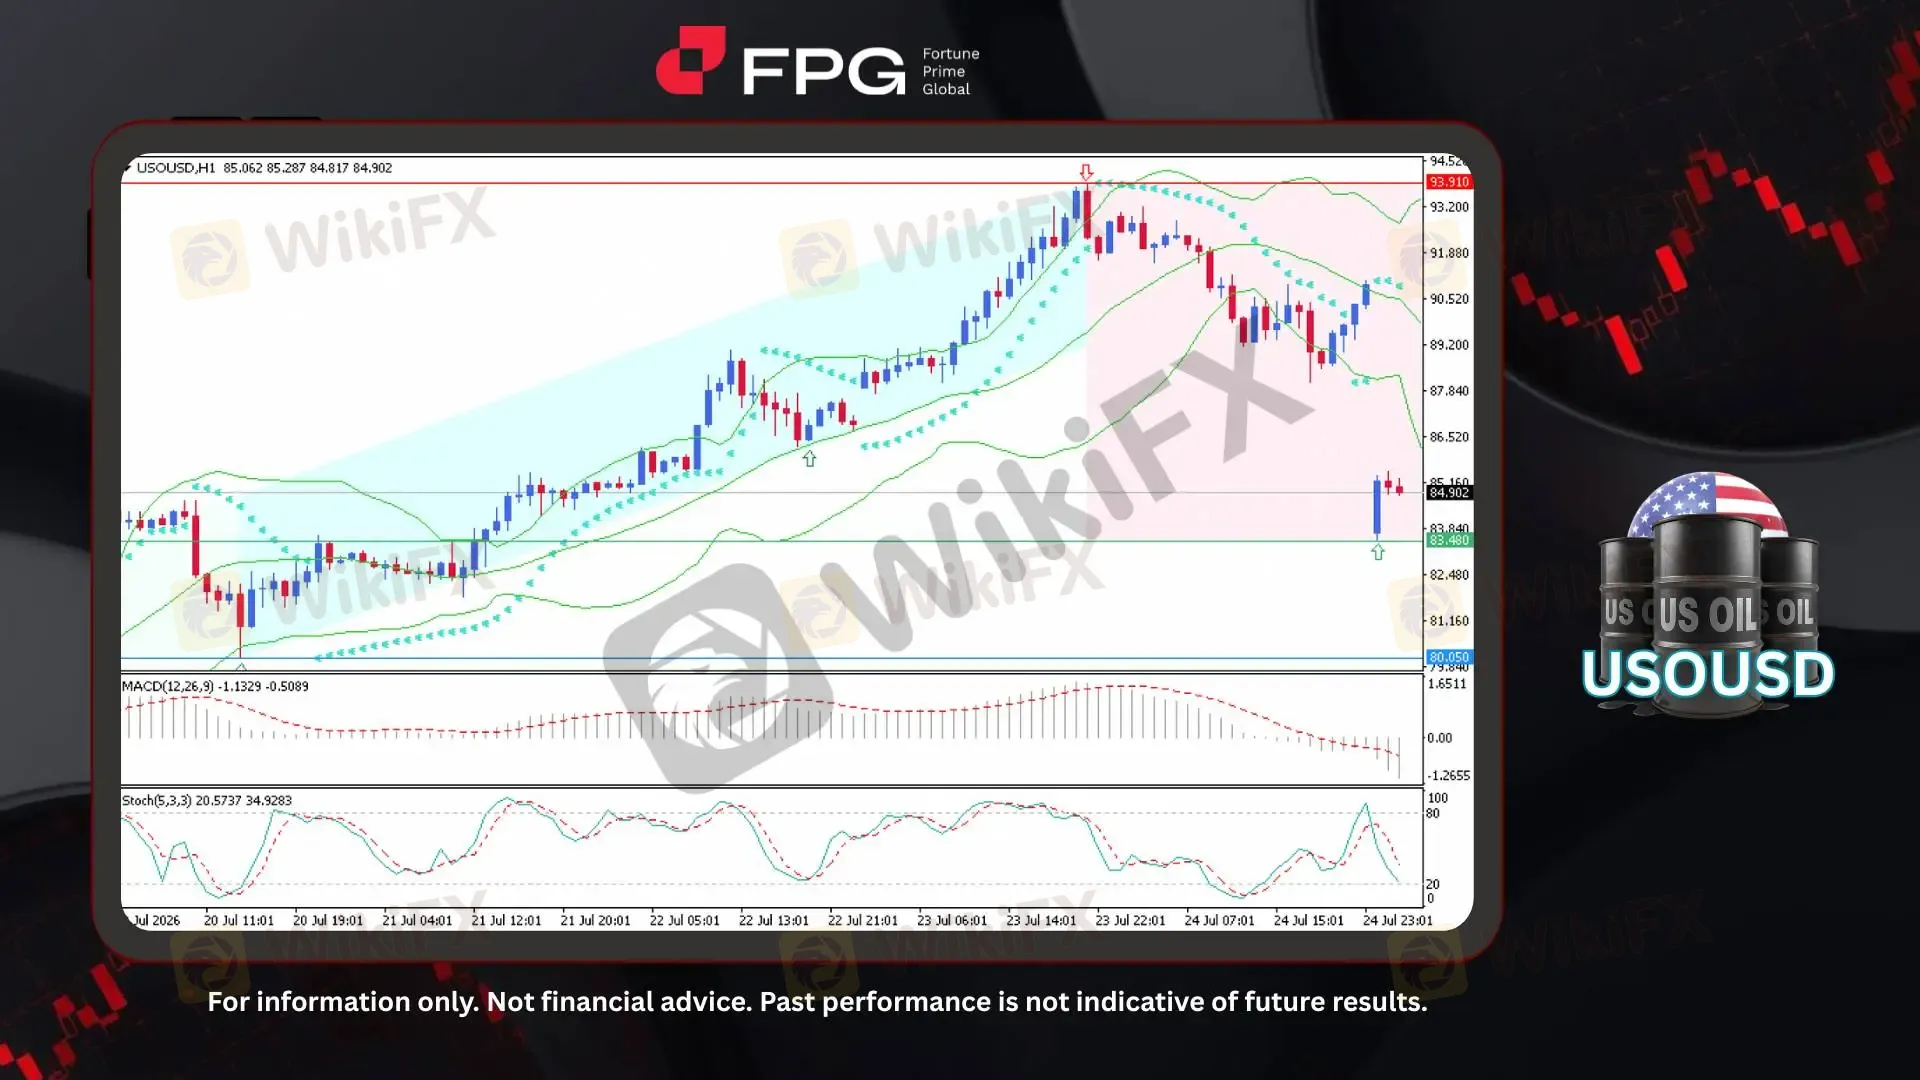
On the H1 timeframe, USOUSD has undergone a sharp and significant correction, declining from 93.91 to 83.48, representing a loss of approximately 11% within a relatively short period. Prior to the selloff, the market had sustained a well-defined bullish trend, rallying steadily from around 80.05 to its recent peak at 93.91. However, the rally lost momentum after encountering strong selling pressure near the highs, triggering a decisive bearish reversal that drove prices rapidly toward 83.48. The latest price is trading around 84.90, with volatility remaining elevated as the market attempts to stabilize following the steep decline.
From a technical perspective, the Bollinger Bands have expanded significantly, reflecting the sharp increase in market volatility following the recent selloff. The Parabolic SAR dots remain positioned above the candlesticks, confirming that bearish momentum continues to dominate the short-term trend despite the latest rebound. Meanwhile, the MACD remains below the zero line, indicating that downside momentum is still prevailing, although the histogram suggests that selling pressure has begun to ease. The Stochastic Oscillator has recovered from oversold territory but is now turning lower again, implying that the recent bounce may lack sufficient momentum and that bearish pressure could re-emerge if sellers regain control.
Recent market developments suggest that crude oil prices are facing renewed downside pressure as expectations of higher OPEC+ production coincide with weaker global demand forecasts and slowing economic activity. At the same time, easing concerns over potential supply disruptions have reduced the geopolitical risk premium, prompting investors to unwind previously established bullish positions. As a result, market sentiment has shifted toward a more cautious and bearish outlook, with expectations of increasing supply outweighing lingering geopolitical risks. These fundamental developments provide a clear backdrop for the sharp decline in USOUSD, helping explain the significant price correction observed over a relatively short period.
Technical Market Overview
1. Current Position: USOUSD is trading around 84.90 after experiencing a sharp bearish correction from 93.91 to 83.48, representing an approximate 11% decline within a relatively short period. Although the price has staged a modest rebound from the recent low, it remains well below the previous peak, indicating that bearish sentiment continues to dominate while the market attempts to stabilize.
2. Resistance Zone: The nearest resistance is located at 90.50–91.20, where the recent rebound is likely to encounter selling pressure. A stronger resistance zone is seen around 93.20–93.91, corresponding to the previous swing high and the origin of the sharp bearish reversal.
3. Support Zone: Immediate support is established at 83.48, the recent swing low that has temporarily halted the decline. If this level fails to hold, the next significant support is located around 80.05, which previously served as the base of the prior bullish rally.
4. Indicator Observation: The Bollinger Bands have widened significantly, reflecting elevated market volatility following the recent selloff. The Parabolic SAR dots remain positioned above the candlesticks, confirming that the short-term trend remains bearish. Meanwhile, the MACD continues to trade below the zero line, indicating persistent downside momentum despite signs that selling pressure is beginning to moderate. The Stochastic Oscillator has rebounded from oversold territory but is turning lower again, suggesting that the recent recovery lacks strong bullish conviction.
5. Technical Summary: USOUSD remains under bearish pressure following a decisive breakdown from its recent bullish trend. While the rebound from 83.48 indicates that buyers are attempting to defend key support, the overall technical structure continues to favor sellers unless the price can reclaim the 90.50–91.20 resistance zone. As long as prices remain below this area, downside risks are likely to persist, with 83.48 and 80.05 remaining the key support levels to monitor.
Market Performance:
Commodities Last Price % Change
UKOUSD 89.52 −5.85%
Key Economic Calendar:
CN: Politburo Meeting
DE: Ifo Business Climate
UK: CBI Distributive Trades
US: Durable Goods Orders & Ex Transp MoM
CA: BoC Market Participants Survey
US: Dallas Fed Manufacturing Index
Risk Disclaimer: This report is for informational purposes only and does not constitute financial advice. Investments involve risks, and past performance does not guarantee future results. Consult your financial advisor for personalized investment strategies.
Disclaimer:
The views in this article only represent the author's personal views, and do not constitute investment advice on this platform. This platform does not guarantee the accuracy, completeness and timeliness of the information in the article, and will not be liable for any loss caused by the use of or reliance on the information in the article.
WikiFX Broker
Latest News
EUR/USD: Bearish Structure Shift
 WikiFX
EURUSD | Demand Zone Holding, Bulls Eyeing Higher Resistance
WikiFXKudotrade Review 2026: Reported Slippage & Trade Execution Issues You Should Know
WikiFXFxPro Opens Five CFDs To Weekend Trading
WikiFXIG Faces Hundreds Of Job Cuts In Global Restructure
WikiFXMalaysia To Host Asia Fintech Regulatory Summit
WikiFXValutrades Rejects Exit Rumors Amid Client Review
WikiFXSEC Alleges $16 Million Ponzi Scheme Targeted 200 Investors
WikiFXWeekend CFD Trading Moves Beyond Gold as Brokers Add Oil, Silver and Indices
WikiFXFX Trading Share Falls Sharply Across Retail CFD Market
WikiFX