

Global Broker Regulation Inquiry App
About WikiFX
English
简体中文
繁體中文
English
Pусский
日本語
ภาษาไทย
Tiếng Việt
Bahasa Indonesia
Español
हिन्दी
Filippiiniläinen
Français
Deutsch
Português
Türkçe
한국어
العربية
اردو



DBG Markets: Market Report for September 2, 2026


Abstract:Middle East Conflict Yields Surge Drive Risk-Off SentimentCompounding equity headwinds, U.S. Treasury yields surged aggressively, with the 10-year Treasury yield vaulting to 4.80%—touching multi-year

Middle East Conflict & Yields Surge Drive Risk-Off Sentiment
Compounding equity headwinds, U.S. Treasury yields surged aggressively, with the 10-year Treasury yield vaulting to 4.80%—touching multi-year highs. The combination of surging energy costs and elevated yields has driven market bets for a September Federal Reserve rate hike up to 67%, delivering a dual blow to global risk appetite.
Key Macro Drivers: Military Escalation & Hawkish Rate Re-pricing
The macro environment is being squeezed by two escalating factors:
• U.S.-Iran Military Conflict Expands
• 10-Year Yield Hits 4.80% & September Hike Bets Rise
Technical Analysis & Major Asset Outlook
US Dollar Index: Safe-Haven Flows & Surging Yields Propel Breakout
The current macro backdrop continues to bolster the greenback via safe-haven inflows and rising bond yields. Strengthened Treasury yields and geopolitical risk aversion have combined to push the US Dollar Index decisively above the 99.50 handle, confirming a near-term bullish reversal posture.
Given the current macro environment, price action is positioned to extend further toward the primary resistance zone anchored near 99.80 – 100.00.
GBP/USD: Technical Downtrend Threatens 1.3500 Support Floor
Cable remains under firm corrective pressure due to persistent dollar strength, with short-term moving average crossovers confirming a bearish posture.
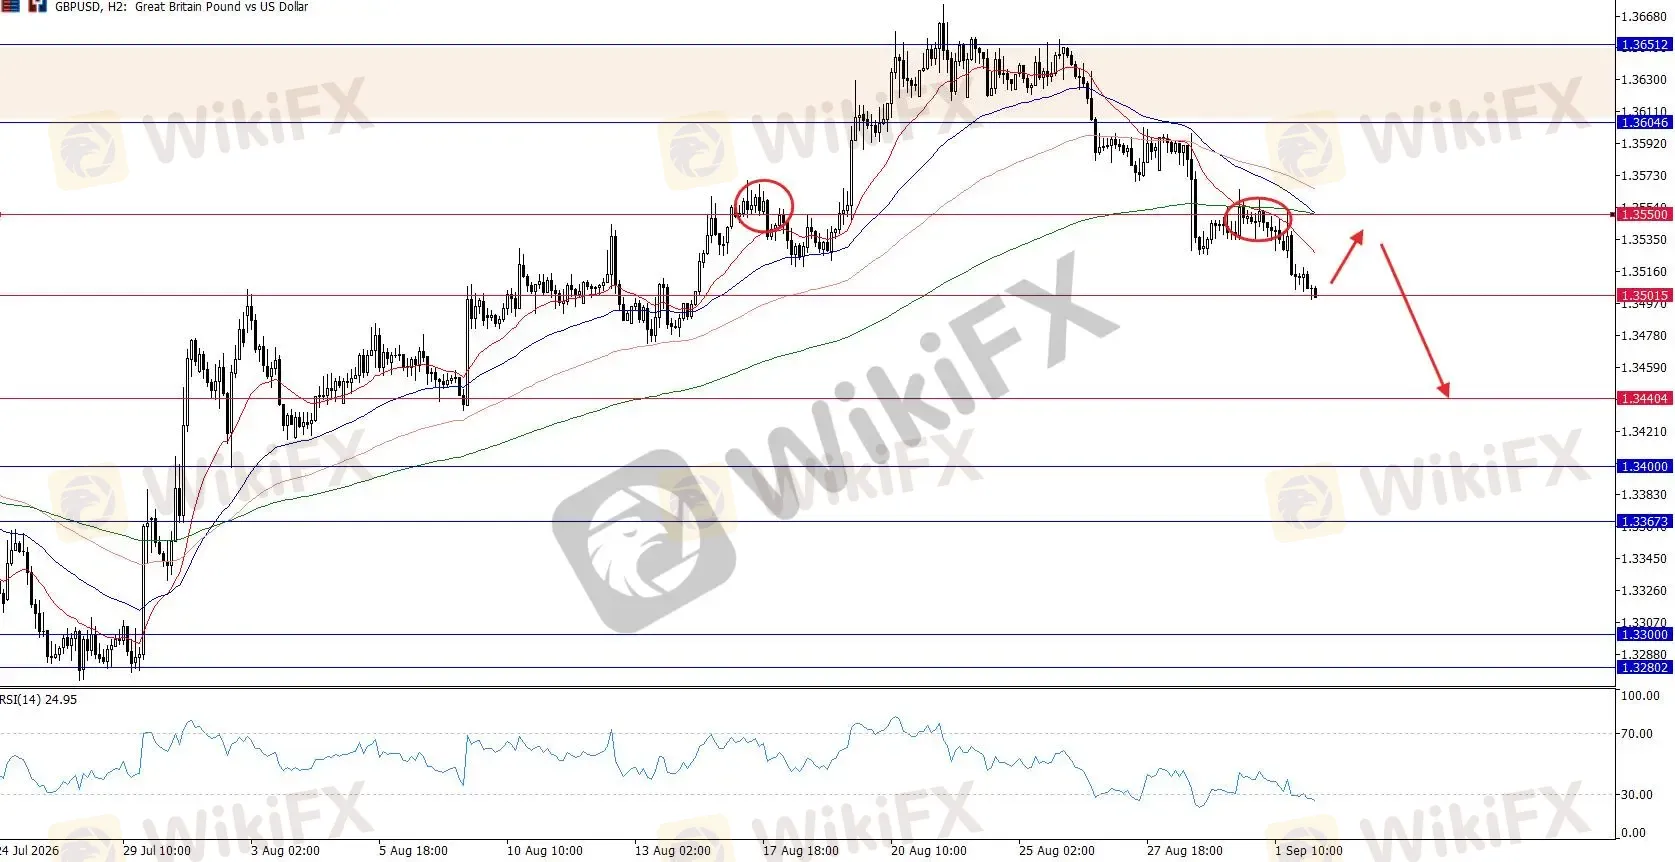
GBPUSD, H4 Chart
The pair has pulled back sharply, breaking below key 1.3550 support as near-term exponential moving averages print a clear bearish crossover. Immediate overhead resistance has now shifted down to the 1.3550 handle, with price action currently testing the major 1.3500 psychological barrier.
EUR/USD: Bearish-to-Consolidation Below 1.1600 – 1.1620 Resistance
EUR/USD mirrors Cable's weak technical footprint as broad dollar strength keeps EUR buyers on the defensive.
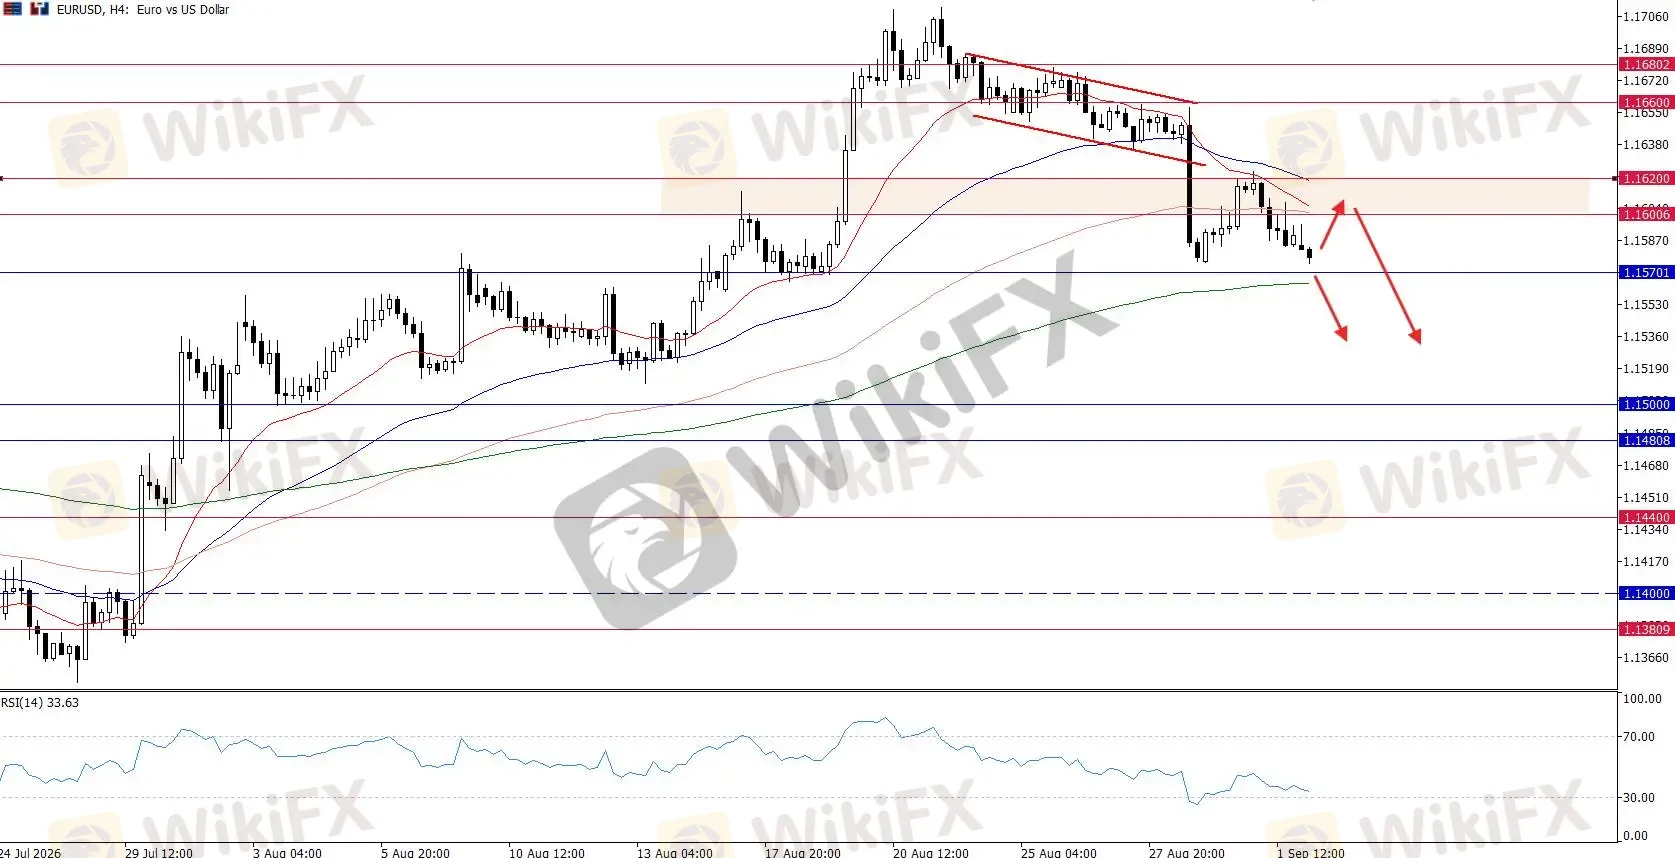
EURUSD, H4 Chart
The pair is testing critical lower boundaries, with the 1.1600 – 1.1620 cluster transitioning into a formidable overhead resistance ceiling.
Spot Gold: Breaks $4,400; $4,300 – $4,320 Support Zone in Focus
Spot gold experienced a sharp breakdown, driven lower by surging bond yields despite ongoing geopolitical safe-haven headlines. Rising yields remain the primary dominant driver dictating gold price action.
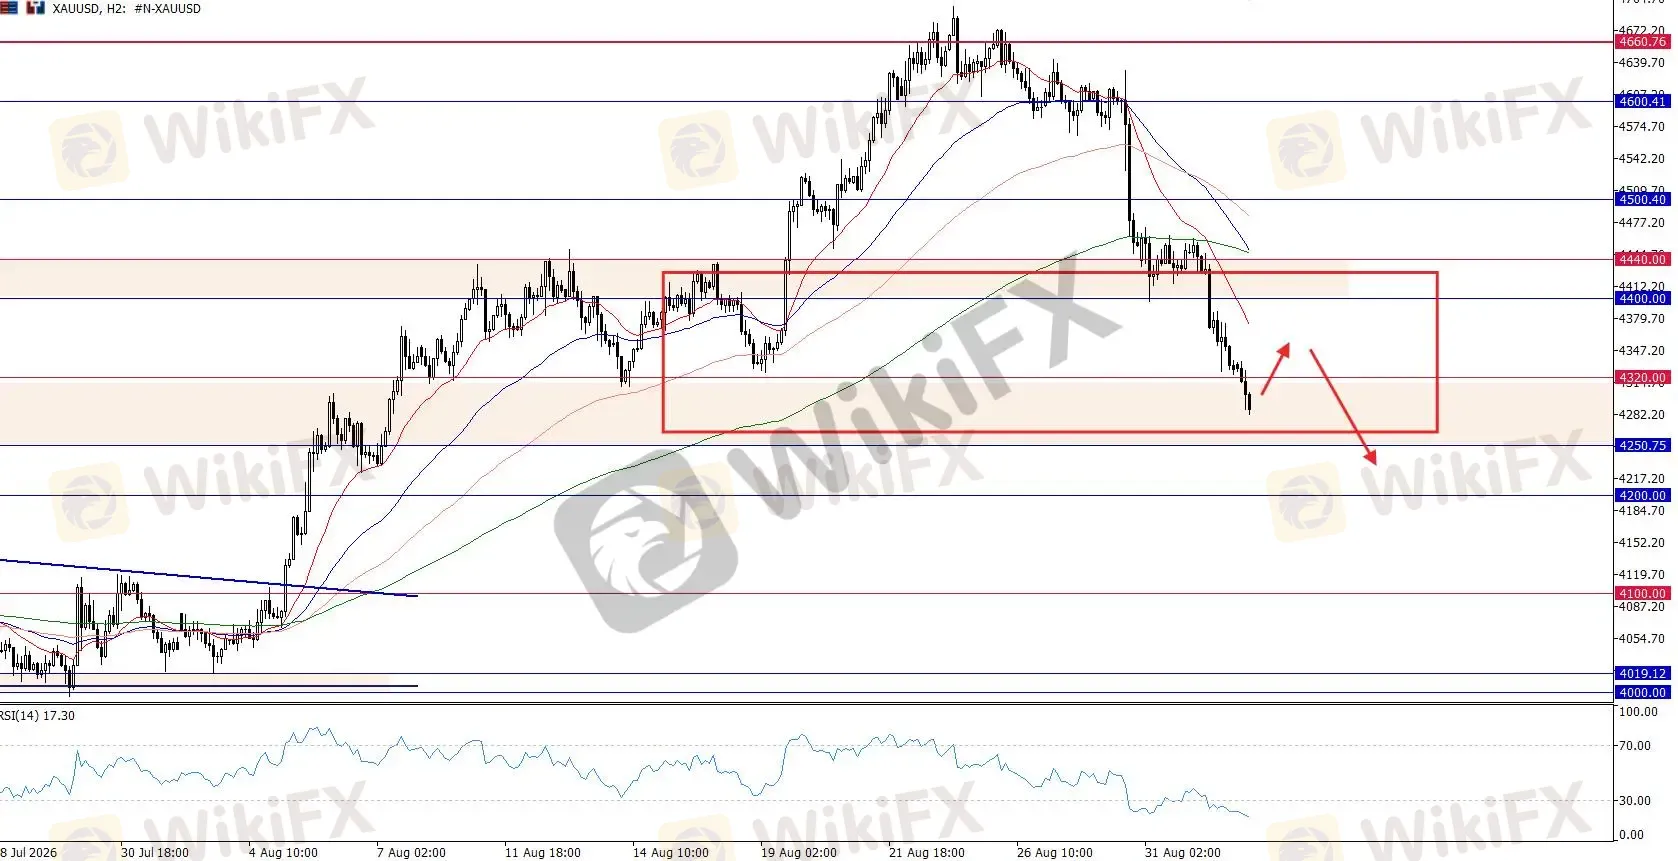
XAUUSD, H2 Chart
Technically, gold broke decisively below the key $4,400/oz floor that held price action earlier in the week, extending its corrective wave down to the primary $4,300 – $4,320 structural support zone.
Overall, a bearish-to-consolidation outlook is anticipated for today's session.
Nasdaq 100 (UT100): Unable to Sustain Recovery; 29,000 Support Level Under Fire
The tech-heavy index saw its recent recovery attempt unspool rapidly, crushed under the weight of surging 10-year yields and broad-based risk aversion. Current market headlines present a crucial headwind capping any bullish runs in equities, particularly for rate-sensitive technology stocks.
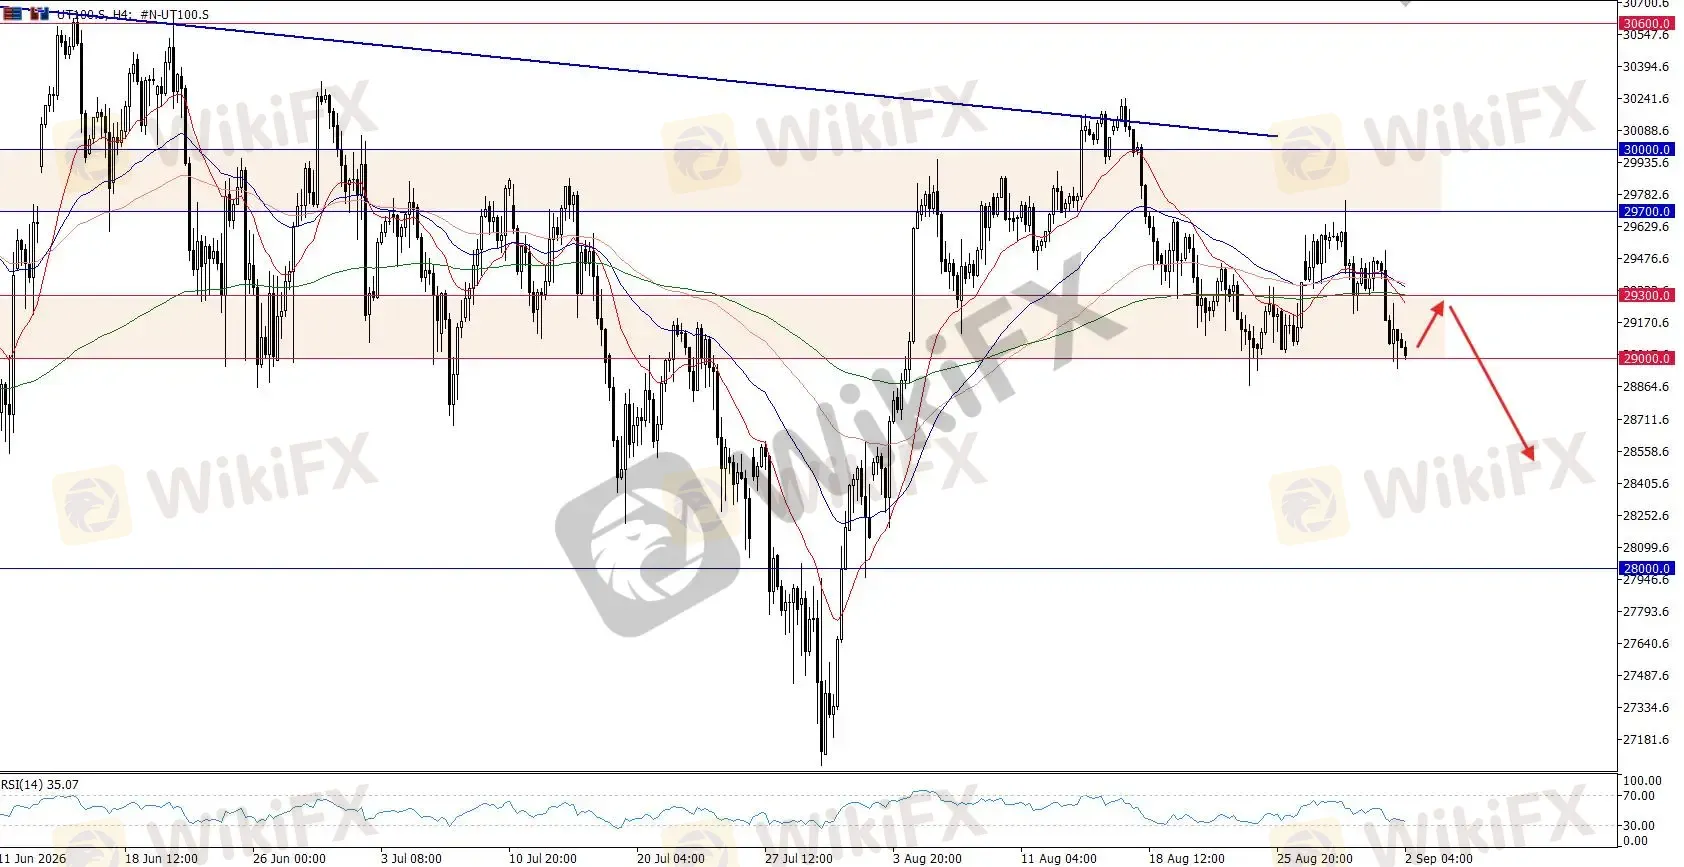
UT100, H4 Chart
The Nasdaq 100s bounce attempt failed to sustain upside momentum, turning price action back down toward its core structural floor.
Bottom Line & Asset Summary
Geopolitical friction between the U.S. and Iran alongside a surge in 10-year Treasury yields to 4.80% has triggered a strong risk-off regime. With market expectations for a September Fed rate hike rising to 67%, this shift will undoubtedly continue to weigh on risk assets while bolstering the U.S. Dollar, as renewed rate-hike bets and elevated Treasury yields keep overall market sentiment cautious.
• US Dollar Index: Bullish Reversal Confirmed; broke above 99.50 resistance, opening upside potential toward 99.80 – 100.00.
• GBP/USD: Bearish-to-Consolidation; capped beneath 1.3550 overhead resistance, with immediate downside risks testing 1.3500 support.
• EUR/USD: Downside Risk Active; capped below 1.1600 – 1.1620 resistance, watching for intraday retests of 1.1570 support.
• Spot Gold (XAU/USD): Breakdown Extended; lost $4,400 support, shifting to a sell-on-rally posture beneath $4,400 with primary dip-buying support anchored at $4,300 – $4,320.
• Nasdaq 100 (UT100): Vulnerable to Corrective Wave; recent recovery failed, keeping focus on the 29,000 psychological support floor.

Disclaimer:
The views in this article only represent the author's personal views, and do not constitute investment advice on this platform. This platform does not guarantee the accuracy, completeness and timeliness of the information in the article, and will not be liable for any loss caused by the use of or reliance on the information in the article.
WikiFX Broker
Latest News
Webull Reenters Canada With Coinbase Crypto Infrastructure
 WikiFX
Gold drops to four-week low as Fed hike bets, Iran tensions lift USD
WikiFXRising gilt yields are not saving the British Pound
WikiFXSilver Price Forecast: XAG eyes 100-day SMA after Waller rally
WikiFXFCA Warns Against Multiple Unauthorised Forex Brokers
WikiFXEUR/JPY Price Forecast: Trades near 181.50 after rebounding from descending channel bottom
WikiFXUnited States Dollar Index hold gains above 99.50 as Treasury yields hit multi-year highs
WikiFXFormer Banker Gets Seven Years After RM1.58 Million Client Fraud
WikiFX02.09.26 Daily Forecast
WikiFXCIMB Tests RM1.38 Billion Tokenised Sukuk Settlement
WikiFX