

Global Broker Regulation Inquiry App
About WikiFX
English
简体中文
繁體中文
English
Pусский
日本語
ภาษาไทย
Tiếng Việt
Bahasa Indonesia
Español
हिन्दी
Filippiiniläinen
Français
Deutsch
Português
Türkçe
한국어
العربية
اردو


Fibonacci 61.8%: A Beginner's Guide to Placing Limit Orders

WikiFX
|


Abstract:Learn what Fibonacci retracement is, how the 61.8% level is calculated, and how some traders use it to place limit orders in trending markets. Includes a step-by-step hypothetical example.
 Contents
What Is Fibonacci Retracement?
Fibonacci retracement is a tool drawn on a price chart to spot potential support or resistance zones during a pullback within a trending market. It works by taking two extreme points – a significant high and a significant low – and dividing the vertical distance by the key Fibonacci ratios: 23.6%, 38.2%, 50%, 61.8%, and 78.6%. The resulting horizontal lines highlight areas where the price might stall or reverse before resuming the original trend.
The underlying numbers come from a sequence first described by the Italian mathematician Leonardo Fibonacci in his 1202 book Liber Abaci. Centuries later, traders observed that financial markets sometimes retrace a portion of a prior move by percentages that align with these ratios, with the 61.8% level often watched closely.
It is important to note: Fibonacci retracement does not predict where price will turn. It simply marks levels that many market participants watch, creating zones of potential support or resistance. This article explains how the 61.8% level is derived and what it means when a trader places a pending order near it – without any suggestion that it guarantees a profitable outcome.
The Sequence Behind the Levels
To understand why 61.8% is considered significant, we must look at the Fibonacci sequence itself. The sequence starts 0, 1, and each subsequent number is the sum of the two preceding ones: 0, 1, 1, 2, 3, 5, 8, 13, 21, 34, 55, 89, 144, and so on.
If you divide a number by the next number in the sequence, the ratio approaches 0.618 (or 61.8%). For example, 34 ÷ 55 ≈ 0.618. Dividing a number by the number two places to the right gives roughly 0.382 (38.2%). The 50% level is not derived from the Fibonacci sequence itself but is commonly included as a midpoint that often acts as a reaction area.
In the context of a currency pair trending higher, a retracement down to the 61.8% level means the pullback has erased about 61.8% of the original rally. This is sometimes seen as a “golden ratio” pullback – deep enough to shake out weak hands, yet still within the bounds of a healthy correction. Traders looking for entries often monitor this area for signs that the trend may resume.
- The Fibonacci sequence: 0, 1, 1, 2, 3, 5, 8, 13, 21, 34, 55, 89, 144…
- Key retracement levels: 23.6%, 38.2%, 50%, 61.8%, 78.6%.
- 61.8% is derived from dividing a number by the next (e.g., 89 ÷ 144 ≈ 0.618).
Drawing and Calculating the 61.8% Level
To apply the tool, you first identify a clear trend – say, an uptrend on the EURUSD daily chart. You then select the Fibonacci retracement tool in your charting platform and draw it from the lowest point of the trend (the “swing low”) to the highest point (the “swing high”). The platform automatically plots horizontal lines at the standard ratios.
Lets walk through a hypothetical example. Assume EURUSD bottomed at 1.1000 and then climbed to a high of 1.1400 over several weeks. The distance is 0.0400 (or 400 pips). The 61.8% retracement level is calculated as:
Level = High – (0.618 × (High – Low))
= 1.1400 – (0.618 × 0.0400)
= 1.1400 – 0.02472
= 1.1153 (rounded)
The other levels would be, for instance, 38.2% at 1.1248 and 50% at 1.1200. The 61.8% level at 1.1153 sits significantly lower. Some traders place a pending buy limit order at or just above this level, anticipating a bounce if price retraces that far. A limit order is an instruction to buy at a specified price or better; it will only execute if the market reaches that price.
- Identify a significant swing low (1.1000) and swing high (1.1400).
- Use the Fibonacci retracement tool to draw from low to high.
- The 61.8% retracement level automatically appears at 1.1153.
- A trader might set a buy limit order at 1.1155, just above the level, to seek entry on a pullback.
Note: This is a purely educational illustration. No actual trade recommendation is intended.
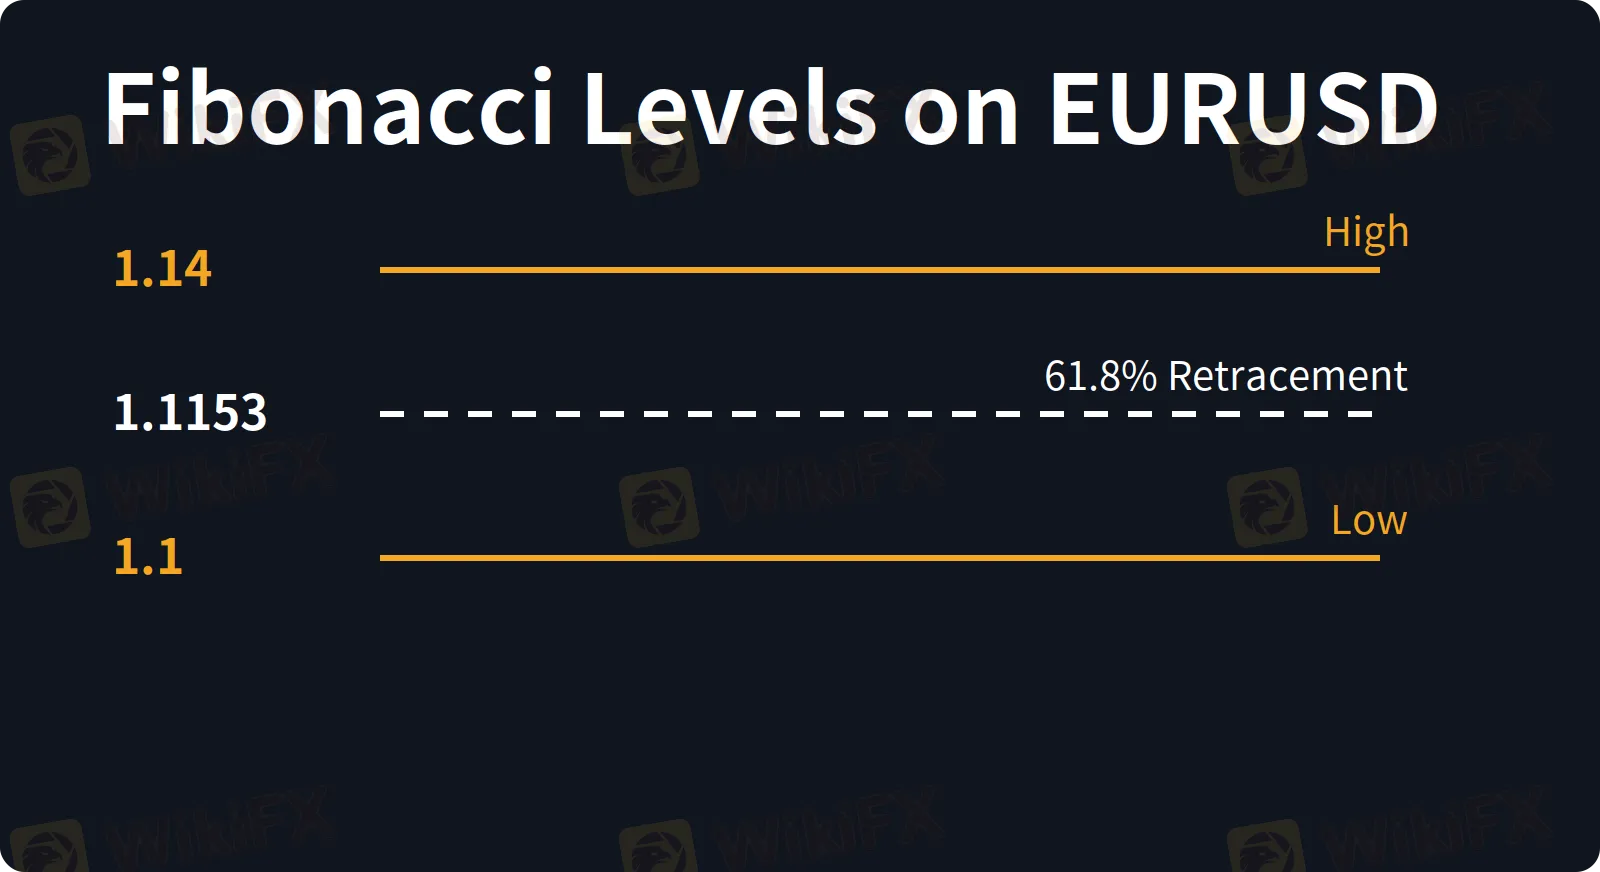
Hypothetical uptrend with key Fibonacci levels marked.
Limitations and Common Mistakes
Fibonacci retracement is a popular yet often misunderstood tool. Its main limitation is that it does not guarantee a reversal. Price can slice through a 61.8% level without pausing, or it can pause for a few candles before breaking further. In a strong downtrend, a 61.8% retracement of a prior rally might only serve as a brief resistance before a resumption of the decline.
Common beginner mistakes include:
- Treating levels as exact points. Trades are rarely filled exactly at the line; price often overshoots or reverses slightly before reaching it. Thinking in zones rather than precise ticks is more realistic.
- Ignoring the trend context. Retracements are most useful when the broader trend remains intact. Using Fibonacci in a choppy, sideways market produces many false signals.
- Setting entries without confirmation. Placing a limit order at 61.8% without watching for price action signals (such as a bullish candlestick pattern) can lead to whipsaws.
- Choosing arbitrary swing points. Different traders may select different highs and lows, yielding different retracement levels. Consistency in selecting obvious swing points helps, but subjectivity remains.
- Using Fibonacci in isolation. The tool is stronger when combined with other confluences such as moving averages, trendlines, or previous support/resistance areas.
The key takeaway: Fibonacci retracement helps identify potential support and resistance zones during pullbacks, but it does not predict price turning points.
Disclaimer:
The views in this article only represent the author's personal views, and do not constitute investment advice on this platform. This platform does not guarantee the accuracy, completeness and timeliness of the information in the article, and will not be liable for any loss caused by the use of or reliance on the information in the article.
WikiFX Broker
Latest News
EURUSD | Demand Zone Holding, Bulls Eyeing Higher Resistance
WikiFXKudotrade Review 2026: Reported Slippage & Trade Execution Issues You Should Know
WikiFXEUR/USD: Bearish Structure Shift
WikiFXFxPro Opens Five CFDs To Weekend Trading
WikiFXValutrades Rejects Exit Rumors Amid Client Review
WikiFX1MDB Recovery Still Leaves RM20 Billion Burden
WikiFXMalaysia Pursues RM4.2 Billion Claim Against Singapore's DBS Bank
WikiFXFxPro Adds Weekend Trading for Five CFD Markets
WikiFXYen Speculators Turn Net Long as USD/JPY Holds Near Seven-Month Low
WikiFX