

Global Broker Regulation Inquiry App
About WikiFX
English
简体中文
繁體中文
English
Pусский
日本語
ภาษาไทย
Tiếng Việt
Bahasa Indonesia
Español
हिन्दी
Filippiiniläinen
Français
Deutsch
Português
Türkçe
한국어
العربية
اردو
FPG USDJPY Market Report July 2, 2026
Abstract:On the H4 timeframe chart, USDJPY continues to maintain strong bullish momentum as the Yen remains under pressure, reaching its weakest level against the U.S. dollar in approximately 40 years. The pai
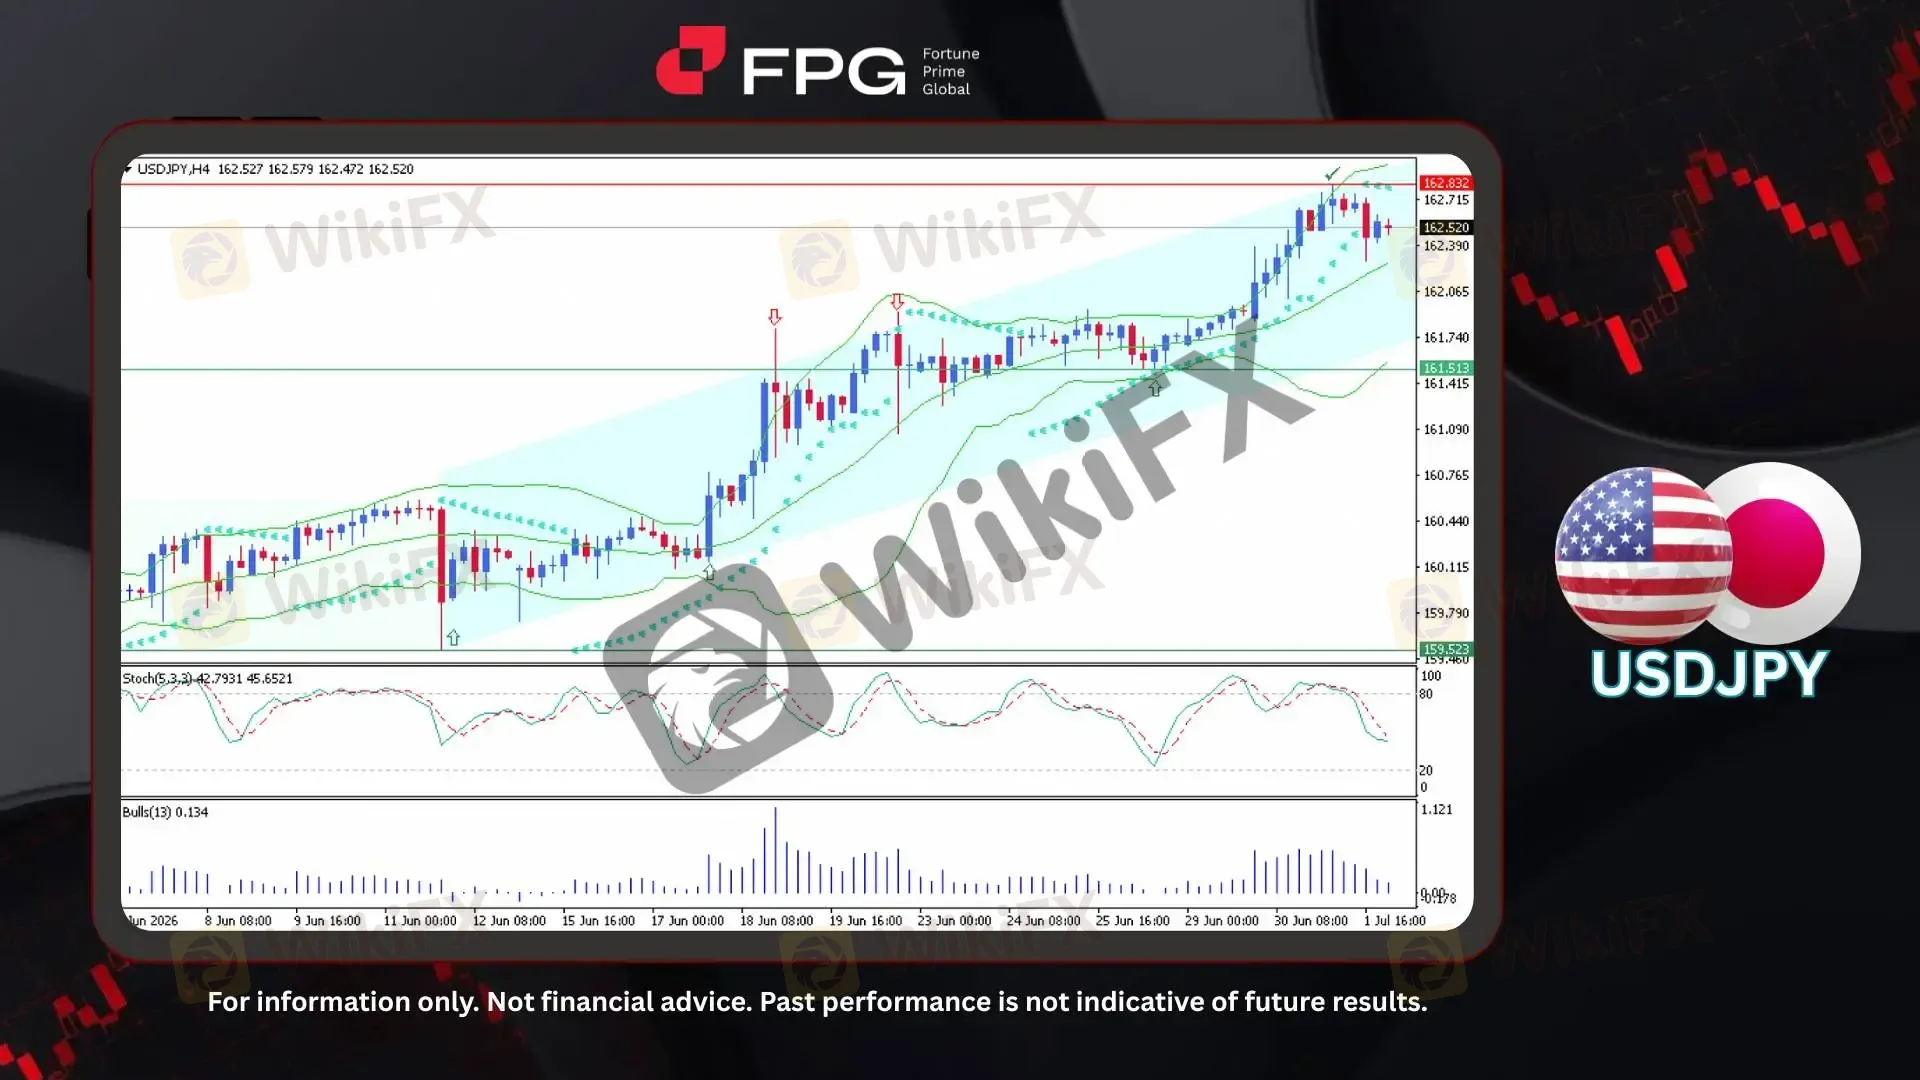
On the H4 timeframe chart, USDJPY continues to maintain strong bullish momentum as the Yen remains under pressure, reaching its weakest level against the U.S. dollar in approximately 40 years. The pair continues its upward movement from the 159.52 support level while trading within a clear ascending channel, confirming a sustained bullish structure. Price recently reached 162.83 and is currently trading around 162.52, remaining close to the recent peak area with elevated volatility. This movement reflects continued USD strength and persistent Yen weakness as buyers remain in control.
From a technical perspective, USDJPY remains in a strong bullish structure, with price holding above the 161.51 support level and continuing within the ascending channel. The Bollinger Bands are widening, indicating increasing volatility and stronger momentum as price approaches the 162.83 resistance area. However, the Parabolic SAR has moved above recent candles, suggesting a potential short-term correction or consolidation. The Stochastic oscillator is declining from the overbought zone, showing reduced buying momentum, while the Bulls Power indicator remains positive, confirming that bullish pressure is still present.
The Yen‘s weakness continues as markets focus on the significant interest rate differential between Japan and the U.S. A stronger U.S. dollar, elevated U.S. bond yields, and global risk sentiment remain key pressures on the JPY. From a macroeconomic perspective, Japan faces challenges from slower growth, accommodative monetary conditions, weaker domestic demand, rising import costs, and fiscal concerns, while investors continue to favor higher-yielding assets. The Bank of Japan is expected to gradually normalize policy through rate hikes but must balance inflation control with economic stability. Overall, cautious BOJ policy, persistent yield differentials, weaker fundamentals, and sustained USD demand remain the main drivers behind the Yen’s recent depreciation.
Technical Market Overview
1. Current Position: USDJPY remains in a strong bullish trend, trading around 162.52 after reaching a recent high of 162.83. Price continues to move within an ascending channel from the 159.52 support level, maintaining a clear higher high and higher low structure while buyers remain in control.
2. Resistance Zone: The immediate resistance zone is located around 162.83, representing the latest peak and a key level for further bullish continuation. A successful breakout above this area could open room for additional upside momentum toward new highs.
3. Support Zone: The nearest support zone is around 161.51, aligned with previous consolidation areas and the lower boundary of the current ascending structure. A break below this level could increase correction pressure and potentially drive price toward the 160.75-161.00 support area.
4. Indicator Observation: The Bollinger Bands are widening, reflecting rising volatility and stronger price movement as USDJPY approaches the recent high. The Parabolic SAR has moved above recent candles, suggesting possible short-term correction, while Stochastic shows easing momentum from overbought levels and Bulls Power remains positive.
5. Technical Summary: USDJPY continues to maintain a bullish outlook as price remains supported above key levels and trades within the ascending channel. Although technical indicators suggest a possible short-term pullback or consolidation, the overall trend remains positive unless price breaks below the 161.51 support zone.
Market Performance:
Forex Last Price % Change
EUR/USD 1.1378 +0.01%
GBP/USD 1.3277 +0.02%
Key Economic Calendar:
AU: Balance of Trade
EU: Unemployment Rate
US: Average Hourly Earnings MoM & YoY
US: Initial Jobless Claims
US: Non Farm Payrolls
US: Participation Rate
US: Unemployment Rate
CA: S&P Global Manufacturing PMI
US: Factory Orders MoM
Risk Disclaimer: This report is for informational purposes only and does not constitute financial advice. Investments involve risks, and past performance does not guarantee future results. Consult your financial advisor for personalized investment strategies.
Disclaimer:
The views in this article only represent the author's personal views, and do not constitute investment advice on this platform. This platform does not guarantee the accuracy, completeness and timeliness of the information in the article, and will not be liable for any loss caused by the use of or reliance on the information in the article.
WikiFX Broker
Latest News
Vonway Forex Review: No Regulation, Withdrawal Complaints, and a Broker Warning
 WikiFX
Rupee Logs Quarterly Gain; Yen Hits 40-Year Low
WikiFXFinalto Review 2026: Regulation, Trading Environment, and Platform Access Risks
WikiFXWHITEFOREX Review 2026: I Am Not the Only Victim of Its Profit Seizure Activity; Users Say This!
WikiFXBelgium’s FSMA Flags 25 Fraudulent Trading Platforms
WikiFXEPFX Review 2026: Should You Trade with This Broker?
WikiFXCash Trust Scheme Cost 1,800 Victims More Than RM100 Million
WikiFXChinese Tycoon Guo Wengui Gets 30 Years in US Prison for $1 Billion Fraud Scheme
WikiFXTHEFALCON MARKETS Review 2026: Is This Forex Broker Safe?
WikiFXACY Securities Review: Regulation Warnings, Withdrawal Pain, and Broker Risk Signals
WikiFXCurrency Calculator
USD

CNY
Current Rate:0
Enter amount
USD
Redeemable Amount
CNY
Calculate 