
Global Broker Regulation Inquiry App
About WikiFX
English
简体中文
繁體中文
English
Pусский
日本語
ภาษาไทย
Tiếng Việt
Bahasa Indonesia
Español
हिन्दी
Filippiiniläinen
Français
Deutsch
Português
Türkçe
한국어
العربية
اردو
FPG AUDUSD Market Report April 14, 2026
Abstract:On the H4 timeframe chart, AUDUSD shows a clear transition from a prior bearish trend into a sustained bullish phase. Previously, price declined from 0.7123 to 0.6833, establishing a strong bearish st
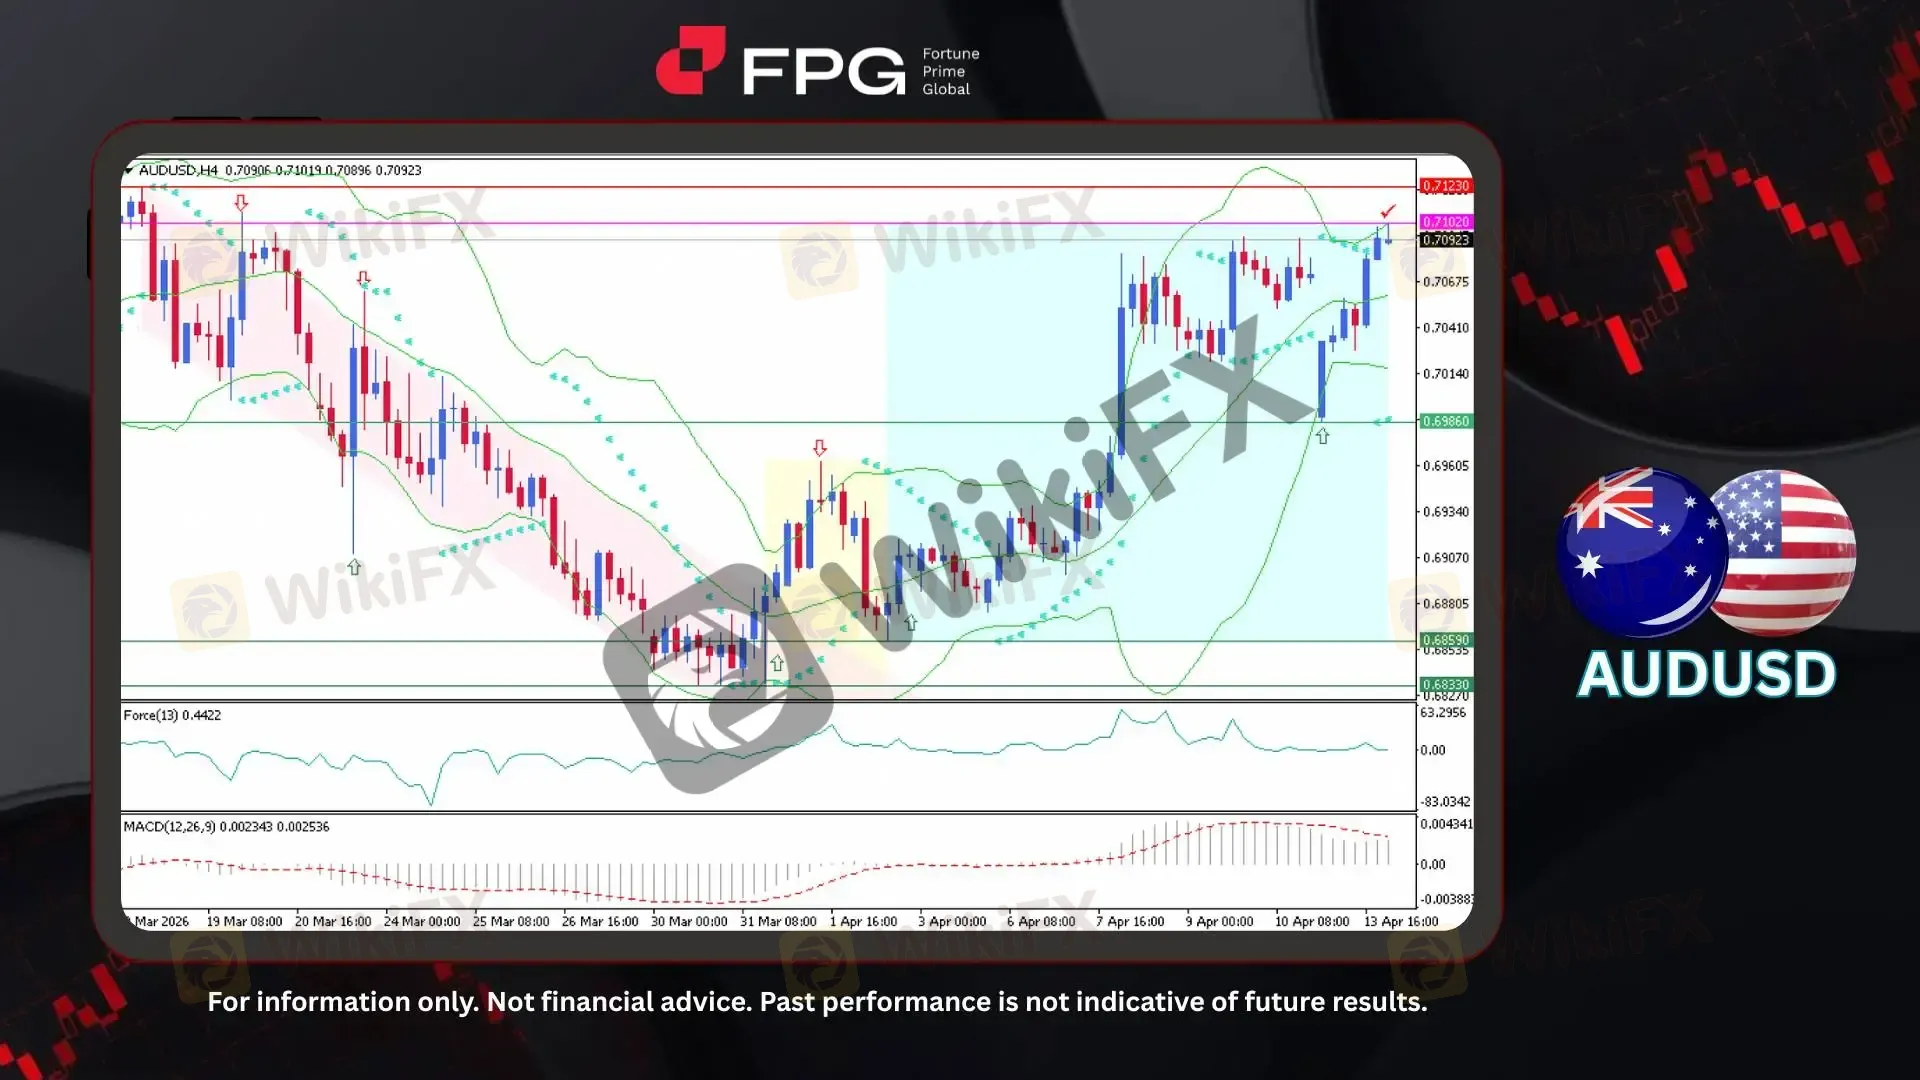
On the H4 timeframe chart, AUDUSD shows a clear transition from a prior bearish trend into a sustained bullish phase. Previously, price declined from 0.7123 to 0.6833, establishing a strong bearish structure. This was followed by a consolidation phase before a bullish reversal formed around 0.6859, initiating an upward rally that pushed the price toward 0.7102. The current price is trading around 0.7092, positioned very close to the resistance zone, indicating that the market is testing a key supply level after a steady bullish climb.
From a technical perspective, Bollinger Bands are expanding again, reflecting increasing volatility as price approaches resistance. The price is currently trading near the upper band, suggesting bullish pressure remains dominant, although a potential rejection cannot be ruled out at this level. The Force Index (13) is positive around 0.44, indicating sustained buying pressure, though momentum appears to be stabilizing. Meanwhile, the MACD (12,26,9) remains in positive territory at approximately 0.00234 / 0.00253, with the histogram showing signs of flattening, which may indicate that bullish momentum is starting to slow as price tests resistance.
Global economic news highlights rising geopolitical tensions, particularly a US-led blockade in the Strait of Hormuz, which has pushed oil prices higher, increasing inflation risks and prompting fiscal responses while central banks reassess tightening policies. At the same time, China‘s data shows softer credit growth, with authorities maintaining a cautious stance and relying more on fiscal support rather than aggressive easing. Globally, central banks are signaling a pause in rate adjustments, while Australia maintains a relatively steady and cautious policy approach. This backdrop supports AUDUSD’s bullish trend, as stronger commodity prices and stable policy expectations boost the AUD against a USD weighed by geopolitical risks.
Technical Market Overview
1. Current Position: AUDUSD is trading around 0.7092, approaching a key resistance zone after a sustained bullish rally.
2. Resistance Zone: The nearest resistance is located at 0.7102, followed by a stronger resistance at 0.7123, marking previous highs.
3. Support Zone: Immediate support stands at 0.6986, with deeper support at 0.6859, representing the origin of the bullish reversal.
4. Indicator Observation: Bollinger Bands are expanding, indicating rising volatility. Force Index (13) remains positive at 0.44, reflecting ongoing buying pressure, while MACD (12,26,9) stays in positive territory but shows signs of momentum flattening.
5. Technical Summary: AUDUSD maintains a bullish structure on the H4 timeframe, supported by positive momentum indicators, but the proximity to a strong resistance zone and early signs of slowing momentum suggest a potential consolidation or short-term pullback before any further upward continuation.
Market Performance:
Forex Last Price % Change
EUR/USD 1.1766 +0.07%
USD/JPY 159.18 −0.15%
Today's Key Economic Calendar:
AU: RBA Hauser Speech
US: Fed Miran Speech
UK: BRC Retail Sales Monitor YoY
AU: Westpac Consumer Confidence Change & Index
AU: NAB Business Confidence
CN: Balance of Trade
CN: Exports & Imports YoY
DE: Wholesale Price MoM & YoY
US: ADP Employment Change Weekly
US: Core PPI MoM & PPI MoM
UK: BoE Gov Bailey Speech
US: Fed Goolsbee & Barr Speeches
Risk Disclaimer: This report is for informational purposes only and does not constitute financial advice. Investments involve risks, and past performance does not guarantee future results. Consult your financial advisor for personalized investment strategies.
Disclaimer:
The views in this article only represent the author's personal views, and do not constitute investment advice on this platform. This platform does not guarantee the accuracy, completeness and timeliness of the information in the article, and will not be liable for any loss caused by the use of or reliance on the information in the article.
WikiFX Broker
Latest News
The Hidden Risks of Margin Calls and How to Trade Trends Safely
 WikiFX
T4Trade Review 2026: Official Warnings and Withdrawal Risks
WikiFXLONG ASIA Review 2026: Withdrawal Complaints and Unverified Regulation
WikiFXTotalFX Dangles 1:1000 Leverage and a $0 Minimum Deposit - But Is Its Regulation Strong?
WikiFXPay a 17% Tax First, Then You Can Withdraw" — How Nixse Allegedly Held One Trader's €25,000 Hostage
WikiFXHow to Read Market Reversals Through Price Action and Indicators
WikiFXA Single TikTok Ad Cost Him RM100,000
WikiFXLONG ASIA Review: Broker Complaints, Regulation Gaps, and Withdrawal Alarms
WikiFXHow Proprietary Trading and Artificial Volume Move Prices
WikiFXCrude Jumps Amid Structural FX Shifts
WikiFXCurrency Calculator
USD

CNY
Current Rate:0
Enter amount
USD
Redeemable Amount
CNY
Calculate 