


India Q1 FY27 GDP Growth Hits 7.8%: 3 Scenarios for INR and Gold
India's Q1 FY27 GDP grew 7.8%, beating a 7.4% poll and RBI's 7.0% projection. See three conditional scenarios for INR, rates and gold.
Original

简体中文
繁體中文
English
Pусский
日本語
ภาษาไทย
Tiếng Việt
Bahasa Indonesia
Español
हिन्दी
Filippiiniläinen
Français
Deutsch
Português
Türkçe
한국어
العربية
اردو




Abstract:Learn about the 5 most powerful forex trading indicators every trader should use. Improve your market analysis, trading decisions, and accuracy with these essential tools.
Forex trading is an adventure that can be both rewarding and demanding. With trillions of dollars exchanged daily, the market attracts traders eager to seize profit opportunities—but without solid tools, charting a successful course is far from easy. Among the essential assets in a trader's toolkit, forex indicators stand out as vital for making smart and timely choices.
Equipped with the right indicators, you can spot market trends, determine optimal entry and exit points, and manage the risks that come with every trade. Below, you'll find an in-depth look at five influential forex trading indicators, along with practical ways to apply them and improve your results.
 Contents
Understanding the markets rhythm—its trends and bouts of volatility—is key to smart trading. By tracking these, you gain clarity on likely price swings and minimize nasty surprises. Here are some of the most reliable indicators used to monitor trends and assess volatility:
Moving averages help smooth out chaotic price action, offering a clearer perspective on where the market is heading. The two workhorse variants are:
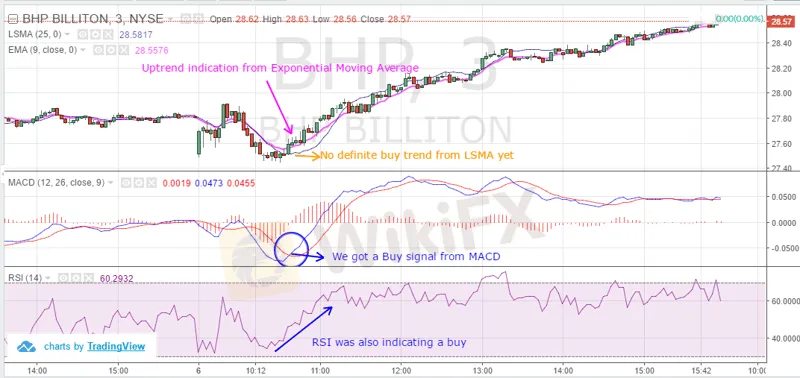
Application: If a currency pairs price jumps above its moving average, traders may take that as a buy signal; a drop below can hint at a possible sell. Moving averages not only flag possible entry and exit points, but also confirm whether a market is trending upward or downward.
Bollinger Bands measure volatility using three lines: a central SMA flanked by bands set at a distance determined by price volatility. When market activity soars, the bands widen; during calm phases, they contract.
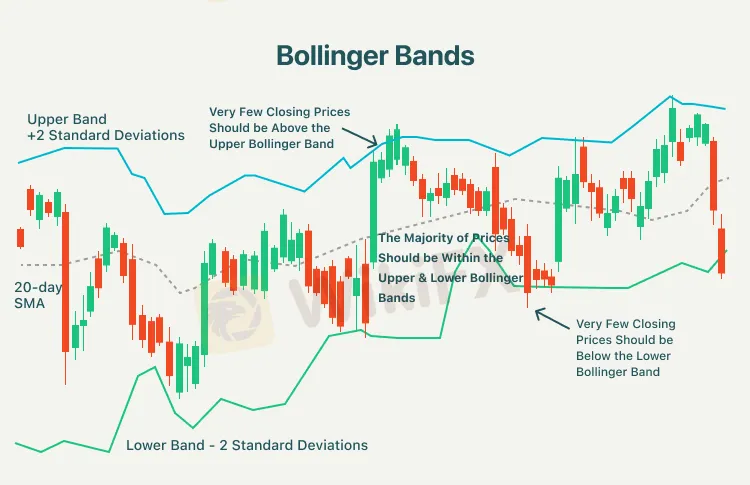
Application: Touching or surpassing the upper band can hint that the market is overbought, while slipping to the lower band may signal oversold conditions. A squeeze—when bands are tight—often comes right before a breakout move, making it an alert for potential opportunities.
Picking the right moments to act is everything in forex. These tools are favorites for those looking to raise their trading accuracy.
RSI is a momentum oscillator mapping the speed and size of price shifts on a 0–100 scale. Levels above 70 often mean a markets overbought, while scores below 30 suggest it could be oversold.
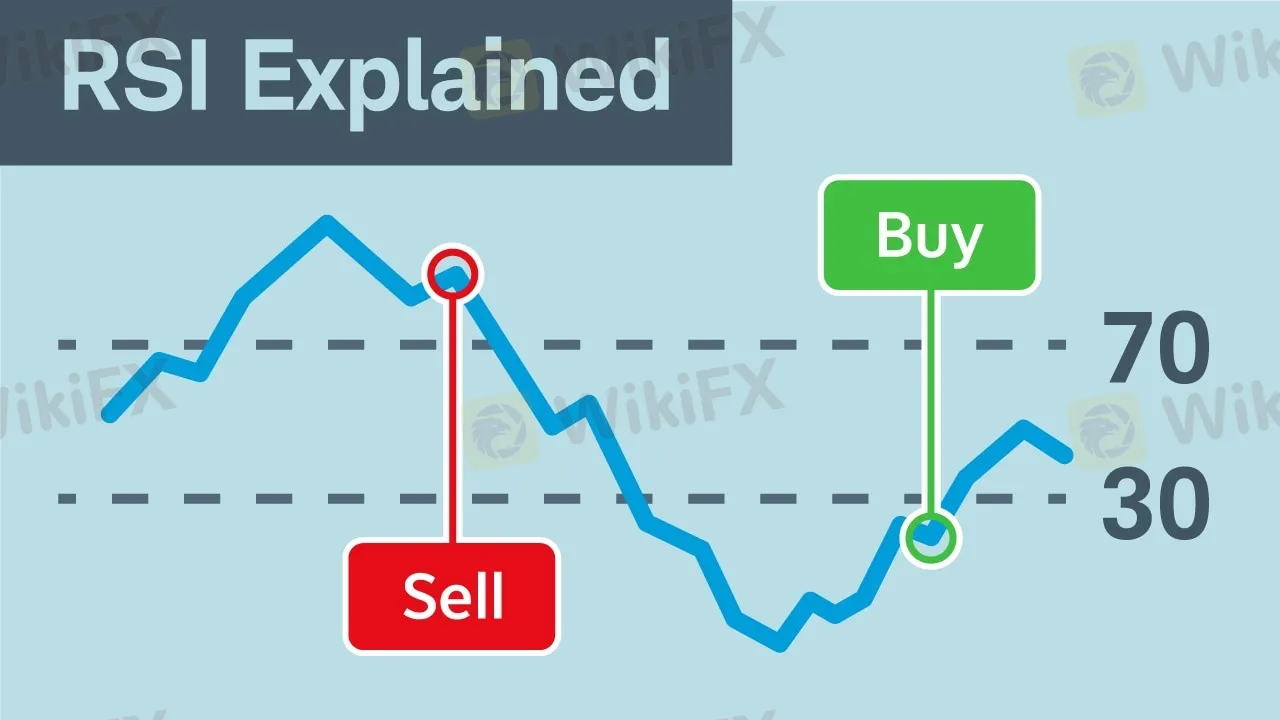
Application: RSI shines at warning about potential trend reversals. If it climbs above 70, a pullback might be on the way. Dip below 30? That could open the door to a rebound. Pairing RSI with other indicators helps confirm signals and reduce false alarms.
MACD tracks the gap between two exponential moving averages, usually set at 12 and 26 periods. Its a favorite for spotting shifts in trend momentum and direction.
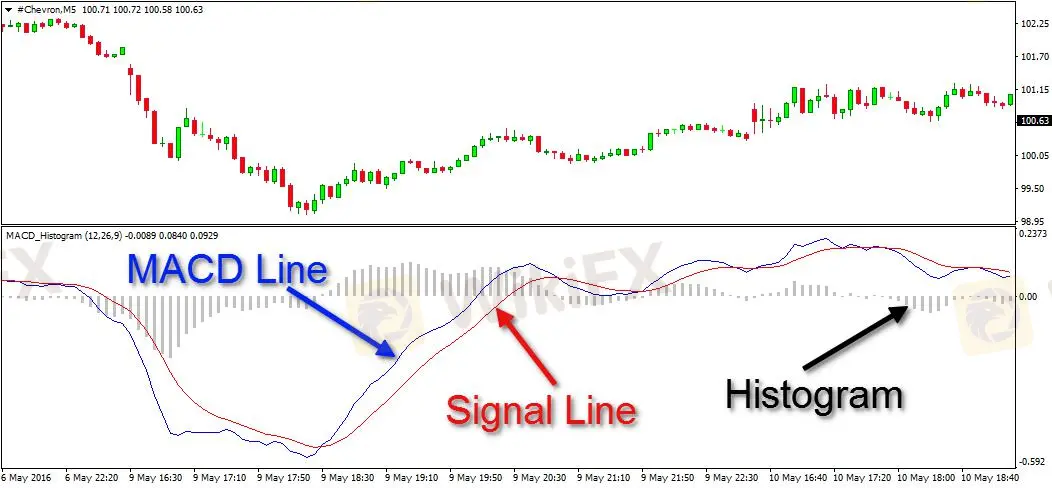
Application: The indicator features the MACD line and its signal line. A cross above the signal hints at buying momentum; a drop below is a selling clue. Additionally, divergences between MACD and price action often flag trend changes ahead.
The Stochastic Oscillator evaluates where a closing price sits relative to the recent trading range, shown on a scale from 0–100.
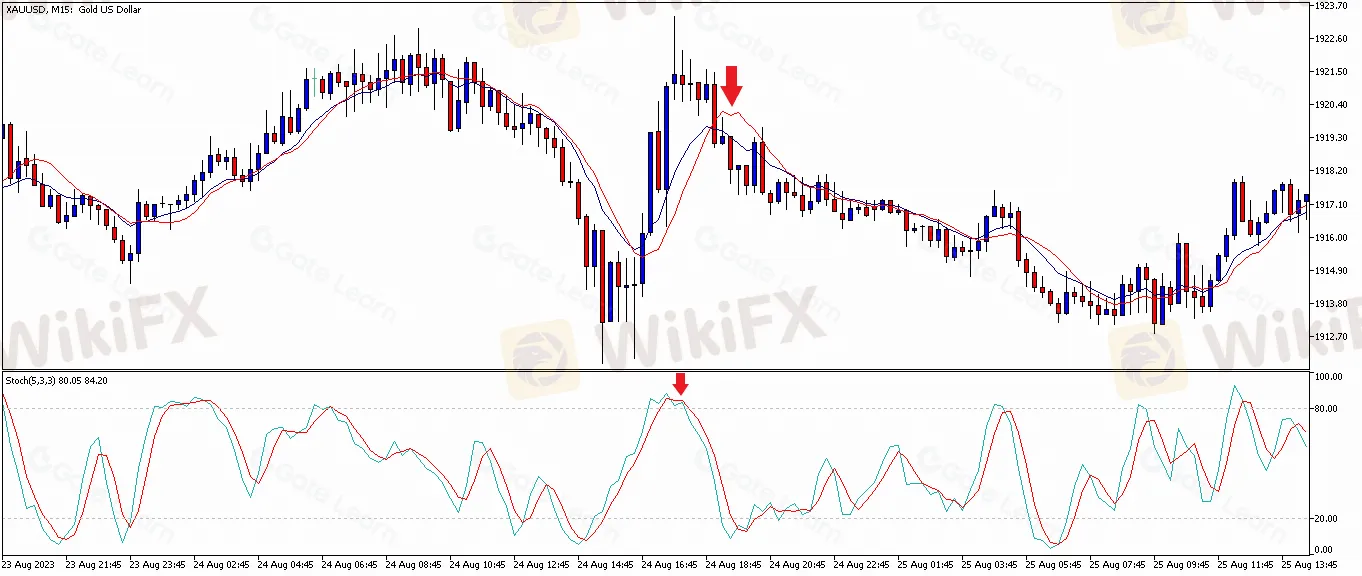
Application: Values above 80 often indicate an overbought condition, while scores below 20 suggest overselling. Traders rely on crossovers within these zones to anticipate reversals—especially when confirmed by other indicators.
Mastering these indicators isn‘t just about understanding each one in isolation; it’s how you weave them together that truly sharpens your trading edge.
While technical indicators are invaluable, they arent magic. A sharp trader also considers:
Harnessing the right mix of indicators—moving averages, Bollinger Bands, RSI, MACD, and the Stochastic Oscillator—can elevate your trading game. When used thoughtfully and combined with solid risk management, these tools tip the odds in your favor when making trading decisions.
Never forget: indicators are guides, not guarantees. The most successful traders are perpetual learners, always testing, refining, and adapting their strategies. Explore these tools, develop your personal approach, and youll carve out your own path to forex trading success.

Disclaimer:
The views in this article only represent the author's personal views, and do not constitute investment advice on this platform. This platform does not guarantee the accuracy, completeness and timeliness of the information in the article, and will not be liable for any loss caused by the use of or reliance on the information in the article.
India's Q1 FY27 GDP grew 7.8%, beating a 7.4% poll and RBI's 7.0% projection. See three conditional scenarios for INR, rates and gold.
Choosing a forex liquidity provider is not a search for the lowest displayed spread or the longest provider list. It is a broker decision about pricing integrity, depth, routing, credit, reporting, incident response, and client communication. This 2026 guide explains how a forex LP, FX liquidity provider, or liquidity provider forex arrangement fits into a broker’s execution chain; what to test before onboarding; why a “best forex liquidity provider” claim cannot replace due diligence; and how to compare cost beyond commission. Use the execution-quality scorecard, provider questions, routing scenarios, and 90-day onboarding plan to assess whether a liquidity relationship can support your actual client mix, instruments, risk model, and jurisdiction. The goal is not to make a universal ranking. It is to build evidence that your broker can explain, supervise, reconcile, and recover its execution service when market conditions are difficult.
The visible fee in an MT4 white label proposal is rarely the real cost of operating it. For an existing broker, the decision is not simply whether an MT4 white label platform is “cheap” or “expensive.” The real question is whether the commercial model remains viable after integration, support, data, client migration, compliance, and exit costs are included. That is why an MT4 white label cost review should be built as a 24- to 36-month operating case. It should compare three credible choices: 1. Keep the present MT4 setup and improve its weakest controls. 2. Replace the MT4 white label provider but retain the client proposition. 3. Migrate selected clients or products to another platform while running MT4 in parallel. This guide explains how to build that case without relying on headline prices or generic vendor claims.
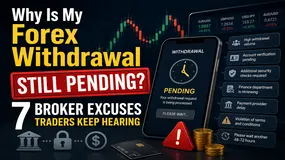
Withdrawal delays are precisely the complaint we keep receiving on WikIFX, a veteran in the forex regulation inquiry space. While some users receive withdrawal access initially and find rejections on their applications later, some fail to receive a single approval. Some delays usually result from genuine compliance requirements that brokers need to adhere to. However, in many cases, traders have accused the broker of repeated excuses as part of its alleged strategy to deny a seamless fund release. A pending withdrawal cannot be an outright indicator of fraudulent activity. Financial institutions, including forex brokerage entities, need to abide by the anti-money laundering (AML) and Know Your Customer (KYC) regulations. However, as the monitoring process stretches beyond weeks or months, traders become frustrated and raise questions over the broker’s reliability.
WikiFXWikiFXWikiFXWikiFXWikiFXWikiFXWikiFXWikiFXWikiFX