

Global Broker Regulation Inquiry App
About WikiFX
English
简体中文
繁體中文
English
Pусский
日本語
ภาษาไทย
Tiếng Việt
Bahasa Indonesia
Español
हिन्दी
Filippiiniläinen
Français
Deutsch
Português
Türkçe
한국어
العربية
اردو
Gold settles above $4,700 on renewed weakness in the US dollar
Abstract:Gold Technical AnalysisGold continues to show exceptional bullish momentum on the 1-hour timeframe after breaking above the previous consolidation zone near $4,700. Price is currently trading near $4,

Gold Technical Analysis
Gold continues to show exceptional bullish momentum on the 1-hour timeframe after breaking above the previous consolidation zone near $4,700. Price is currently trading near $4,750 after a sharp impulsive rally. The moving averages are in a perfect bullish alignment, with MA5 above MA10 and both comfortably above the MA20, while all three averages are sloping upward.
From a technical perspective, the $4,700–$4,685 region is now the key support zone to watch. As long as price remains above that area, the bullish structure remains firmly intact. A sustained break above $4,750 could trigger another momentum expansion toward higher resistance levels around $4,770 and potentially $4,800. On the downside, only a strong rejection followed by a move back below 4685 would suggest weakening momentum and open the door for a deeper corrective pullback.
Gold 1H Chart
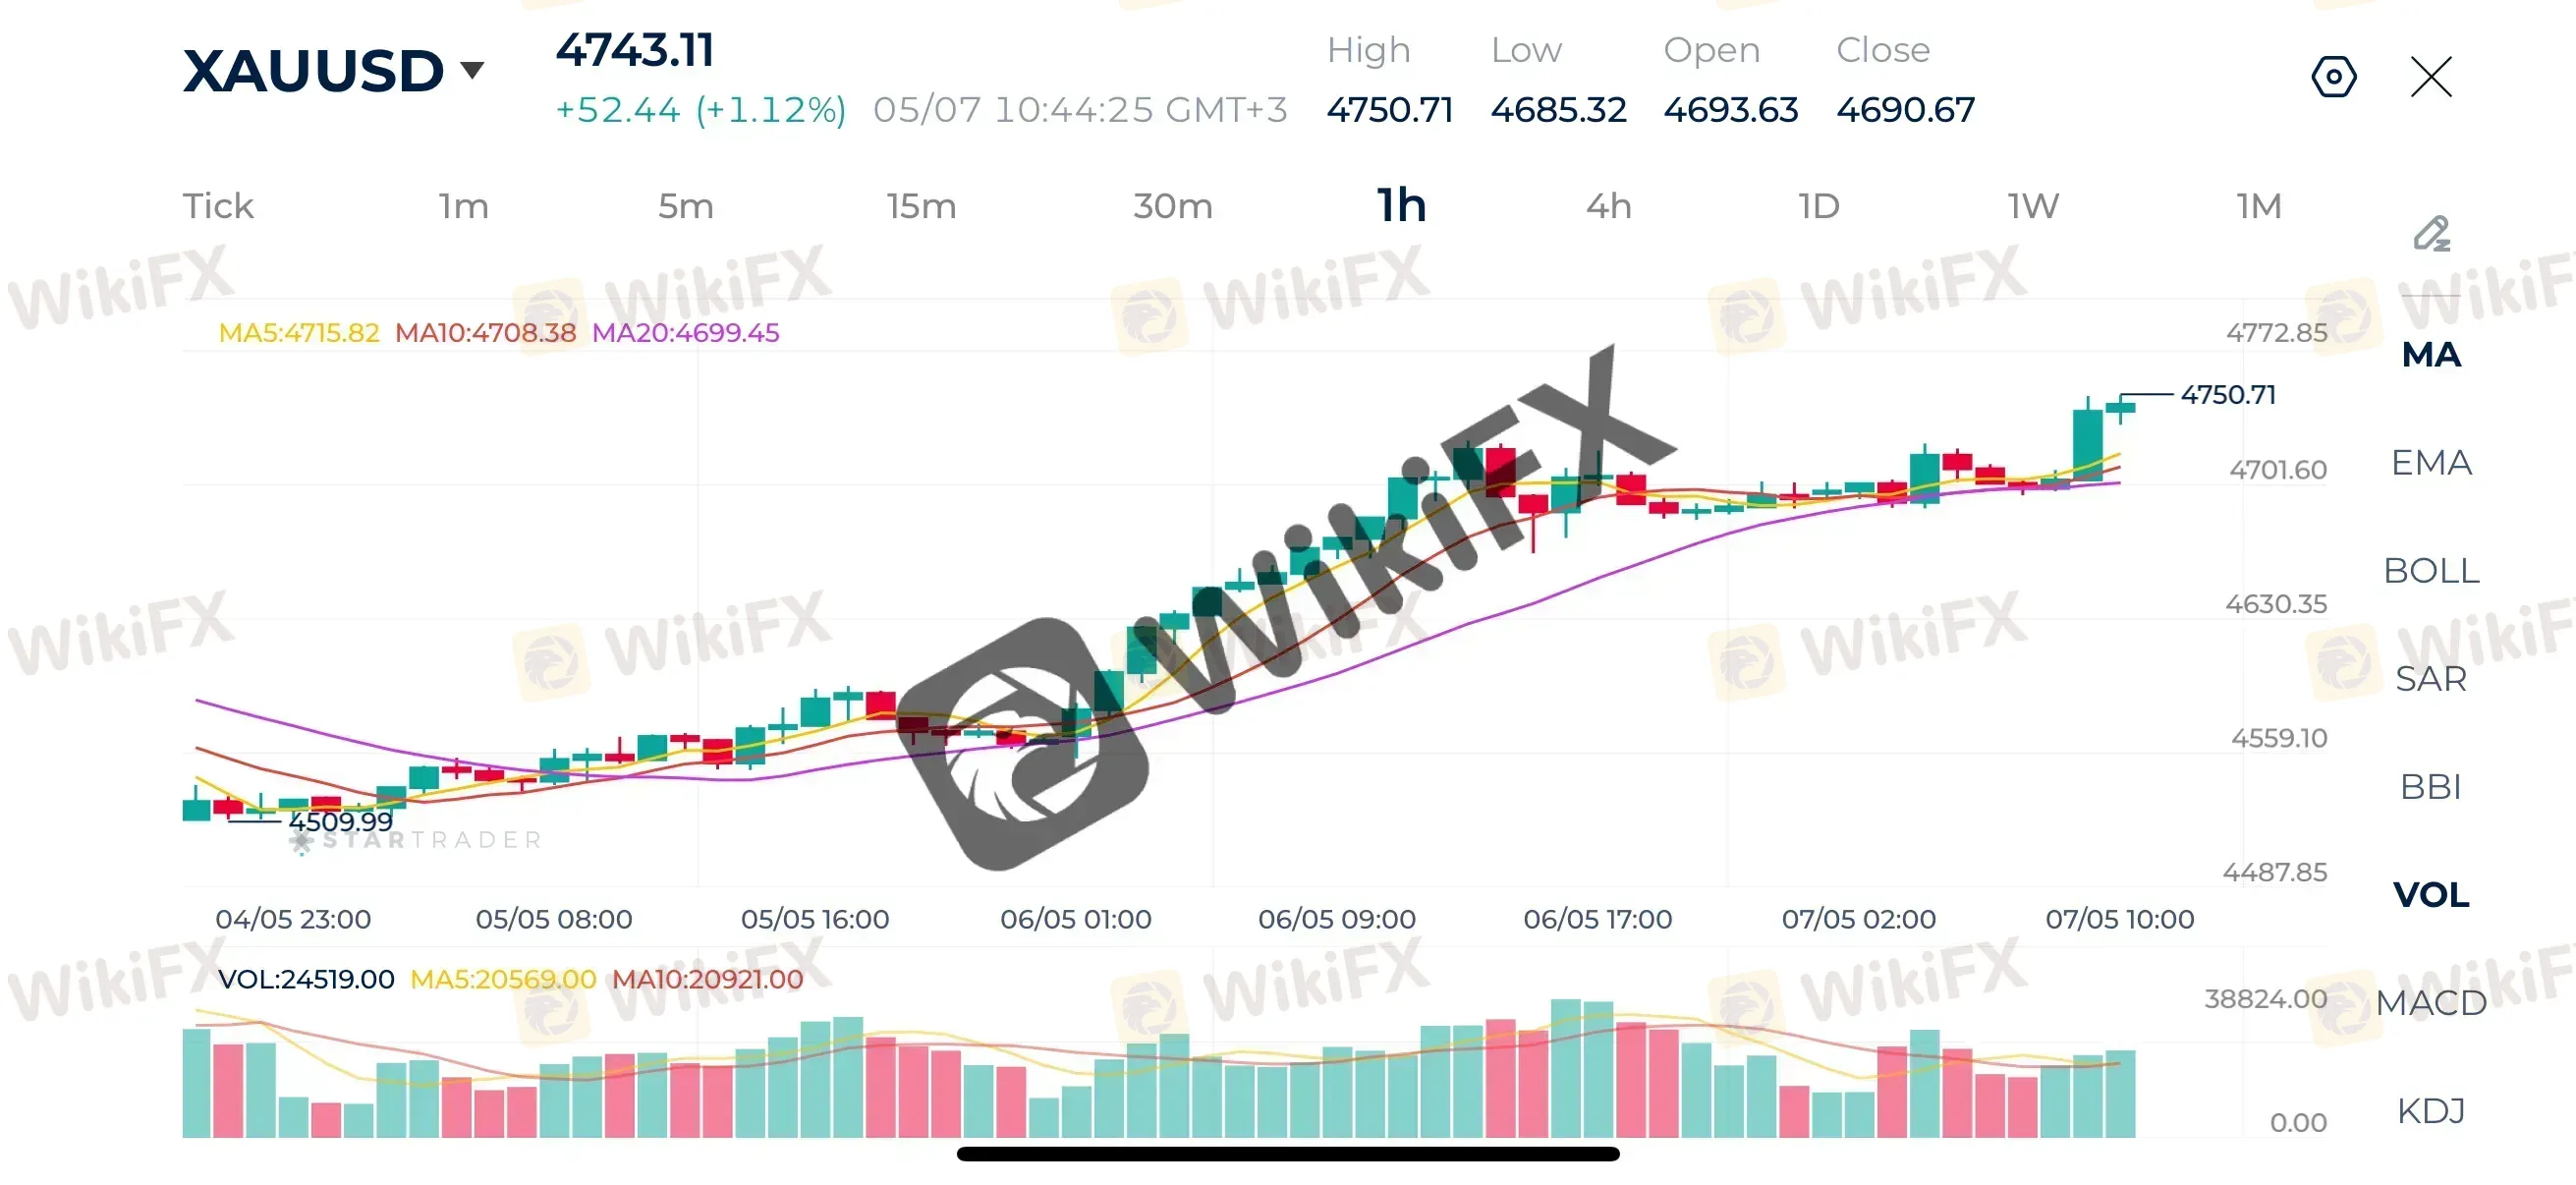
Source: STARTRADER App | Gold settles above $4,700 benefitting from a weaker dollar
Brent Technical Analysis
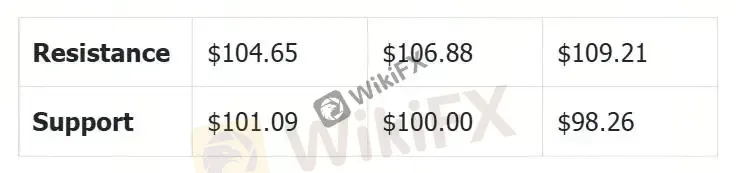
Oil remains under intense bearish pressure after completely failing to recover from the earlier rejection near $120. The breakdown below the $110 support zone accelerated bearish momentum significantly and triggered a sharp sell-off toward the $101 area. Although price attempted to stabilize temporarily around $104–$105, sellers quickly regained control and pushed the market lower again.
The moving averages strongly support the bearish outlook. Price is trading below the MA5, MA10, and MA20, while all three averages are sloping downward, confirming sustained downside momentum.
The $104.50–$105.00 area is now an important resistance zone. As long as price remains below it, the bearish trend remains dominant. A continuation lower could expose the previous low near $101 and potentially psychological support around $100.
Brent 1H Chart

Source: STARTRADER App | Oil prices fall nearly 10% on hopes of a peace deal
S&P 500 Technical Analysis
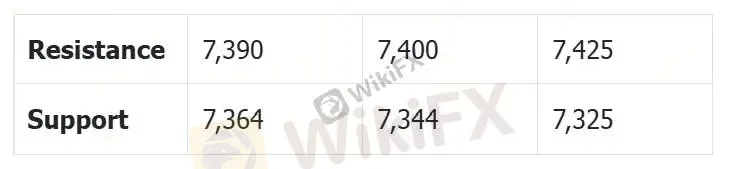
The S&P500 maintains a very clean bullish structure. The recent move has developed through controlled bullish continuation, where pullbacks remain shallow and buyers consistently defend support zones.
Price is currently testing the $7,390 region after breaking above several prior resistance levels. The moving averages confirm the strength of the trend, with the MA5 leading above the MA10 and both staying above the rising MA20.
Momentum remains bullish unless price falls back below the $7,360–$7,350 support region. That area now acts as a key short-term demand zone and aligns with the moving averages. If buyers maintain control above this level, the market could continue extending toward fresh highs beyond 7,400. A breakdown below the MA20 would be the first meaningful warning sign of weakening momentum, but currently the overall structure still strongly favors continuation to the upside.
S&P 500 1H Chart

Source: STARTRADER App | The S&P 500 breaks a new record high above 7,300
Disclaimer:
The views in this article only represent the author's personal views, and do not constitute investment advice on this platform. This platform does not guarantee the accuracy, completeness and timeliness of the information in the article, and will not be liable for any loss caused by the use of or reliance on the information in the article.
WikiFX Broker
Latest News
EMAR MARKETS Review 2026: Complaints, High Leverage, and Withdrawal Risk Signals
 WikiFX
EMIRAX MARKETS Review 2026: Unregulated Status, High Leverage, and Withdrawal Complaints
WikiFXHow the Bullet Theory Fixes the Habit of Overtrading
WikiFXReview 2026: Interactive Brokers Regulation, Complaints, and Platform Access
WikiFXReview 2026: STMARKET Regulation, MT5 Access, and Withdrawal Complaint
WikiFXOver 100 Malaysian Retirees Gather to Expose How Investment Scams Wiped Out Their Life Savings
WikiFXSquaredFinancial Review 2026: Heavy Complaints, Withdrawal Delays, and Profit Deletions
WikiFXUbuntu Invest Review 2026: Is This Forex Broker Safe?
WikiFXMaking Sense of Central Bank News: How Revaluation, Interest Rates, and Reserves Move Currencies
WikiFXFive Chinese Fined RM4,000 Each for Promoting Cryptocurrency Investment Scheme in Malaysia
WikiFXCurrency Calculator
USD

CNY
Current Rate:0
Enter amount
USD
Redeemable Amount
CNY
Calculate 