
Global Broker Regulation Inquiry App
About WikiFX
English
简体中文
繁體中文
English
Pусский
日本語
ภาษาไทย
Tiếng Việt
Bahasa Indonesia
Español
हिन्दी
Filippiiniläinen
Français
Deutsch
Português
Türkçe
한국어
العربية
FPG USOUSD Market Report March 9, 2026
Abstract:On the H4 timeframe chart, USOUSD (US Oil) shows a strong bullish breakout after the price had previously remained very stable for weeks (or even months when viewed on a broader chart with a higher ti
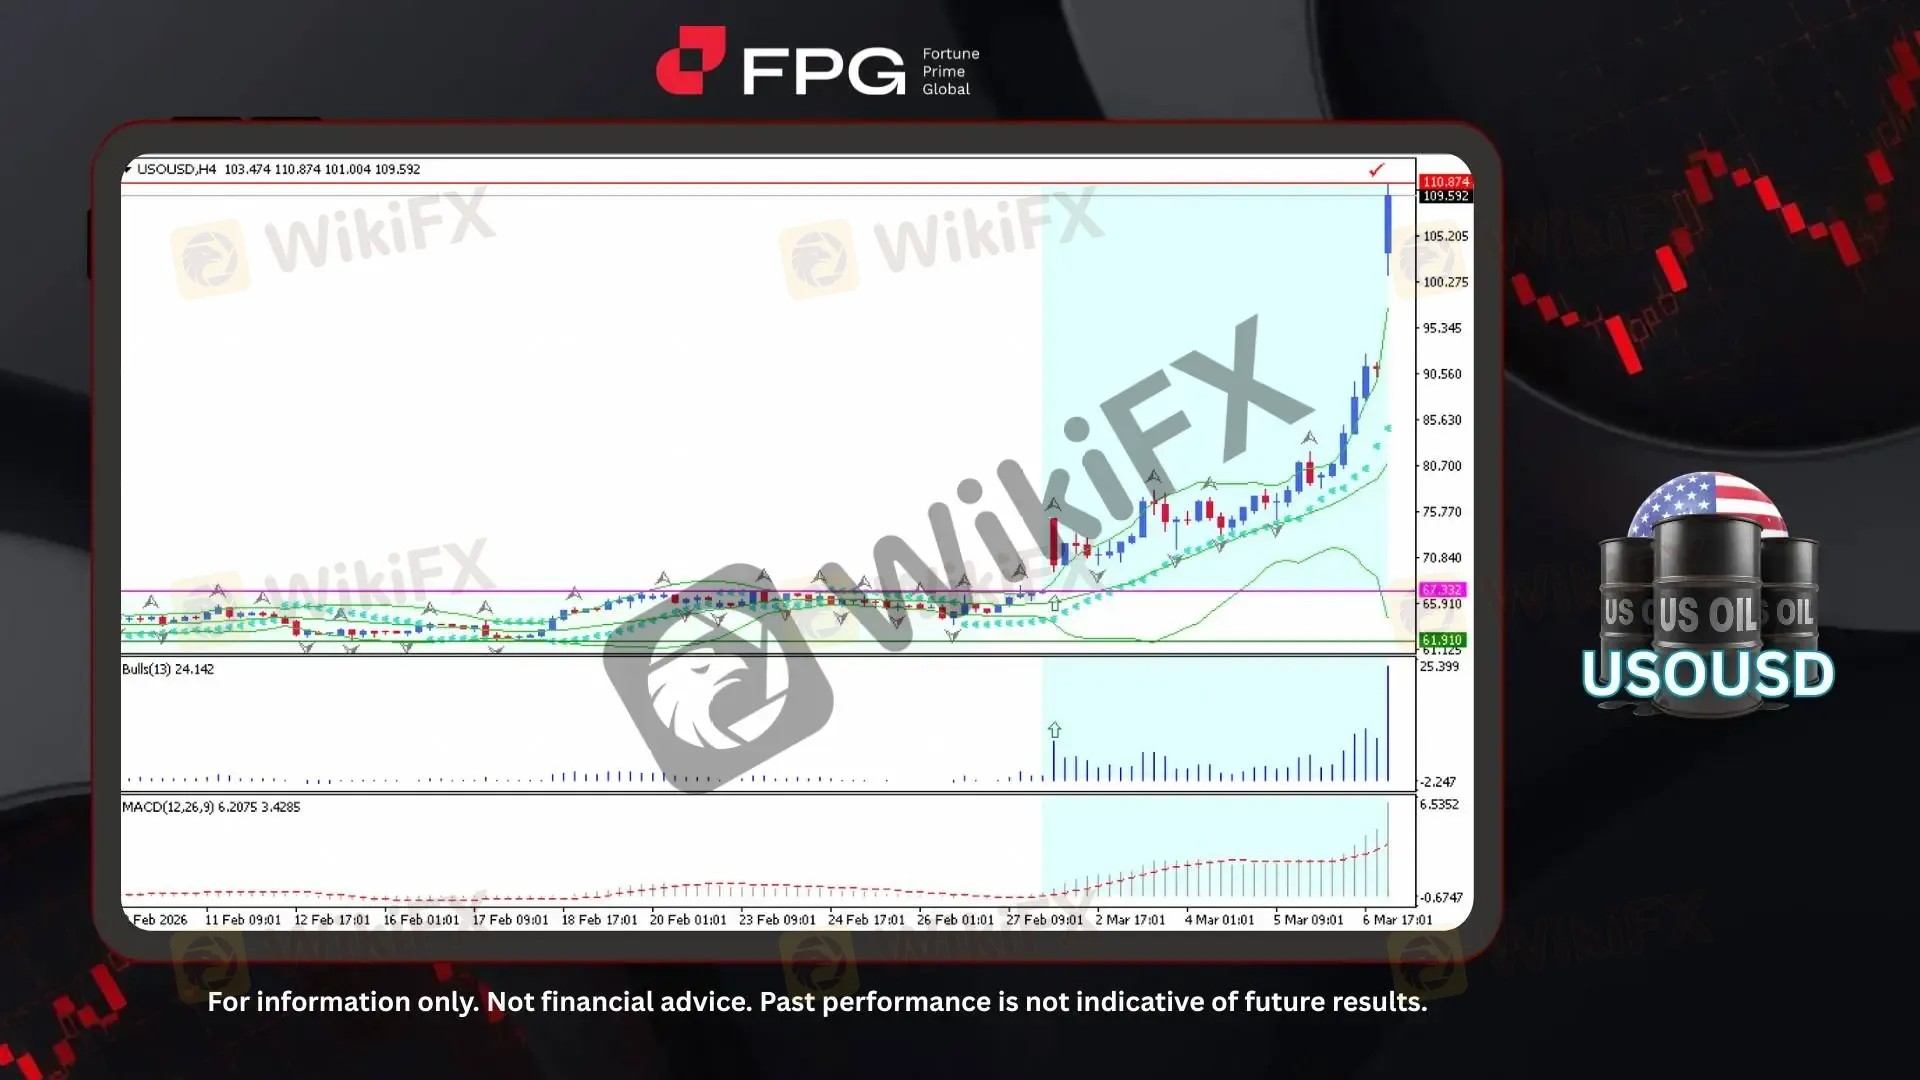
On the H4 timeframe chart, USOUSD (US Oil) shows a strong bullish breakout after the price had previously remained very stable for weeks (or even months when viewed on a broader chart with a higher timeframe). Price broke above the 67.33 resistance and surged sharply, reaching a high of 110.87 within a relatively short period. The latest price is currently around 109.59, reflecting extremely high volatility as the market accelerates upward following the breakout.
From a technical indicator perspective, the overall structure strongly supports the current bullish momentum. The Bollinger Bands have widened significantly, indicating expanding volatility as price moves along the upper band, which typically signals strong trend continuation. The Parabolic SAR dots remain positioned below the price candles, confirming the ongoing bullish trend structure. Meanwhile, the Bulls Power (13) indicator has risen sharply to positive territory, reflecting strong buying pressure and dominance of buyers in the market. In addition, the MACD (12,26,9) histogram is expanding above the zero line with the signal line trending upward, suggesting strengthening bullish momentum and continued positive market sentiment in the short to medium term.
Technical movements in USOUSD are closely linked to underlying fundamental developments in the global energy market. Recent price action has been heavily influenced by geopolitical tensions in the Middle East, particularly involving Iran and security risks around the Strait of Hormuz, a critical route for global oil supply. These developments have increased the geopolitical risk premium and raised concerns about potential supply disruptions, supporting upward pressure on oil prices. At the same time, traders continue to monitor monetary policy signals from the Federal Reserve and production decisions by OPEC+, as both factors could significantly influence future demand, supply balance, and overall market direction.
Technical Market Overview
1. Current Position: USOUSD is trading around 109.59 after a strong bullish breakout from a long consolidation, reaching a recent high at 110.87 with significantly increased volatility.
2. Resistance Zone: The nearest resistance is located around 110.87, marking the recent peak of the current rally.
3. Support Zone: The nearest support is seen around 95.00 – 90.50, while 67.33 remains a key structural support from the previous breakout level.
4. Indicator Observation: Technical indicators broadly support the bullish trend. Bollinger Bands are expanding, reflecting increasing volatility as price moves along the upper band. Parabolic SAR dots remain below the candles, confirming the ongoing bullish structure. Meanwhile, Bulls Power (13) is rising in positive territory, and MACD (12,26,9) remains above the zero line with an expanding histogram, indicating strengthening bullish momentum.
5. Technical Summary: Overall, the technical structure suggests that USOUSD remains in a strong bullish trend following the recent breakout. However, the sharp price acceleration and elevated volatility may also increase the potential for short-term consolidation or pullback before the next directional move develops.
Market Performance:
Commodities Last Price % Change
UKOUSD 108.97 +16.91%
Today's Key Economic Calendar:
JP: Current Account
CN: Inflation Rate MoM & YoY
CN: PPI YoY
DE: Factory Orders MoM
DE: Industrial Production MoM
Risk Disclaimer: This report is for informational purposes only and does not constitute financial advice. Investments involve risks, and past performance does not guarantee future results. Consult your financial advisor for personalized investment strategies.
Disclaimer:
The views in this article only represent the author's personal views, and do not constitute investment advice on this platform. This platform does not guarantee the accuracy, completeness and timeliness of the information in the article, and will not be liable for any loss caused by the use of or reliance on the information in the article.
WikiFX Broker
Latest News
CHINA FUTURES Login: Secure CFFEX Access & Safety Guide
 WikiFX
CAPITARIA Review 2026: Should You Trade With This Broker?
WikiFXRM108,000 Gone: WhatsApp Stock Scam Trapped a Retiree with Promises of 80% Returns
WikiFXASX Markets Regulation: Is This Forex Broker Safe?
WikiFXWhy Paid Forex Signals Cannot Replace a Personal Trading System
WikiFXHEADWAY Review 2026: Is this Forex Broker Legit or a Scam?
WikiFXPhaseForex Review 2026: Is this Forex Broker Legit or a Scam?
WikiFXAxi Says 46% of Clients Now Hold Crypto Exposure
WikiFXDUHANI Regulation & License Review: Is This Broker Safe? An In-Depth Analysis
WikiFXClose Up With WikiFX - A Closer Look at InterStellar Group
WikiFXCurrency Calculator
USD

CNY
Current Rate:0
Enter amount
USD
Redeemable Amount
CNY
Calculate 