
Global Broker Regulation Inquiry App
About WikiFX
English
简体中文
繁體中文
English
Pусский
日本語
ภาษาไทย
Tiếng Việt
Bahasa Indonesia
Español
हिन्दी
Filippiiniläinen
Français
Deutsch
Português
Türkçe
한국어
العربية
February FMS Fund Manager Survey Report
Abstract:The February FMS survey was conducted from February 6 to February 12 and published on February 17. A total of 190 fund managers participated, collectively overseeing $512 billion in assets under manag
The February FMS survey was conducted from February 6 to February 12 and published on February 17. A total of 190 fund managers participated, collectively overseeing $512 billion in assets under management (AUM).
AI Capex Concerns Reach Record High
The February survey shows that the percentage of managers who believe corporate AI capital expenditures are overheating rose to 35%, up from 26% in January, marking a new historical high.
This reflects growing concern among long-only buy-side managers on Wall Street that hyperscale cloud service providers (CSPs) are significantly ramping up capital expenditures, potentially pressuring free cash flow (FCF). These concerns help explain why equity valuations are struggling to expand further despite ongoing AI optimism.
(Figure 1. FMS Managers View AI as Overheated | Source: BofA)Cash Levels Remain Historically Low
Managers cash allocations increased modestly from 3.2% in January to 3.4% in February. However, overall cash levels remain near historic lows as a percentage of total portfolio AUM.
(Figure 2. FMS Managers Cash Levels at 3.4% | Source: BofA)Monthly Positioning Shifts: Tech Reduced, Cyclicals Increased
On a month-over-month basis, managers significantly reduced exposure to technology stocks in February, while increasing allocations to energy and materials sectors.
(Figure 3. FMS MoM Positioning Changes | Source: BofA)
Crowding in the “Magnificent Seven” declined to 20%, suggesting positioning is less extended than previously. However, gold remains the most crowded trade, with 50% of managers identifying it as the most crowded positioning globally.
(Figure 4. Gold Remains the Most Crowded Trade | Source: BofA)Global Economic Outlook: “No Landing” Becomes Majority View
The February survey indicates that 6% of managers continue to expect a hard landing over the next 12 months, unchanged from January.
Expectations for a soft landing declined from 44% to 40%, while the proportion anticipating a “no landing” scenario rose to 52%, now representing a majority view.
Under the no-landing outlook, managers expect simultaneous acceleration in economic growth, inflation, and corporate earnings. Notably, the share of managers forecasting double-digit earnings growth surged from 10% in January to 24% in February.
(Figure 5. FMS Remains Constructive on Global Growth | Source: BofA)Rates Higher for Longer, Dollar Softer Under Potential Warsh Fed
Following President Trumps formal nomination of Kevin Warsh as the next Federal Reserve Chair in January, 38% of surveyed managers expect U.S. Treasury yields to remain elevated under a Warsh-led Fed, while the U.S. dollar is anticipated to stay weak.
(Figure 6. Yields Elevated, Dollar Weak | Source: BofA)EM Equities Benefit from Weak Dollar Thesis
Against the backdrop of expected dollar weakness, managers are increasing allocations to emerging market equities.
As previously noted, the recent rally in Asian markets appears partially driven by global liquidity inflows rather than purely fundamental improvements.
(Figure 7. FMS Managers Increasing EM Equity Exposure | Source: BofA)Gold Technical Analysis
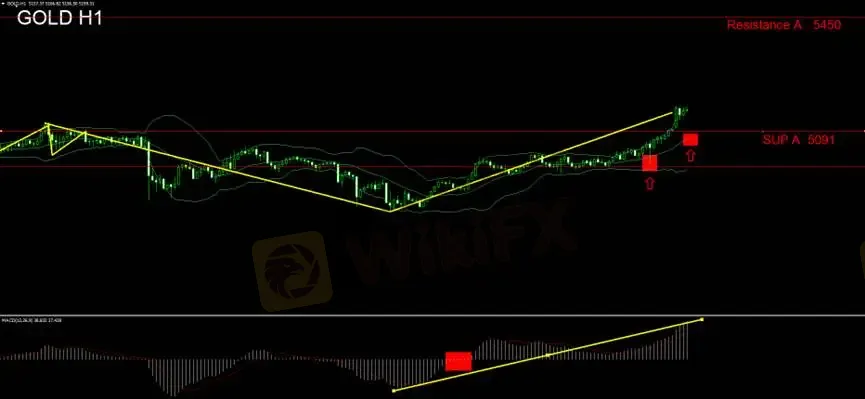
Gold prices have reclaimed the 5,091 level, reestablishing short-term bullish control. The former resistance now serves as support, suggesting a shift in market structure.
Traders should closely monitor the 5,091 support zone, which may present an opportunity to accumulate on pullbacks.
Following the breakout, Bollinger Bands have expanded upward. From a technical standpoint, the middle band should be watched as dynamic support. A successful retest and stabilization above the mid-band would favor initiating long positions. Short-side positioning is not recommended at this stage.
The MACD oscillator remains firmly above the zero line, with expanding histogram bars signaling strong bullish momentum and continued upside follow-through.
Stop-loss: $40
Support: 5,091
Resistance: 5,450
Risk Disclosure
The views, analyses, research, price levels, and other information provided above are for general market commentary only and do not represent the official position of this platform. Readers assume full responsibility for any investment decisions made based on this content. Please trade prudently and manage risk accordingly.
Disclaimer:
The views in this article only represent the author's personal views, and do not constitute investment advice on this platform. This platform does not guarantee the accuracy, completeness and timeliness of the information in the article, and will not be liable for any loss caused by the use of or reliance on the information in the article.
WikiFX Broker
Latest News
Q2 Broker Evaluation Campaign V2.0
 WikiFX
NZD Strength Without a Rate Hike: The Market Is Pricing a Policy the RBNZ Has Not Delivered
WikiFXCLEANO Review 2026: Is this Forex Broker Legit or a Scam?
WikiFXChina’s Renminbi Challenges Dollar Dominance | What It Means for Malaysia
WikiFXNew Traders Keep Losing — And It's Not Because of Their Strategy
WikiFXDubai Warning Issued After Fraudsters Impersonate a Legitimate DIFC Financial Firm
WikiFXItaly Blocks 32 More Unauthorized Financial Websites
WikiFXFXTM Moves to Deepen UAE Presence with Planned Licence Upgrade
WikiFXDeriv Review 2026: Is this Forex Broker Legit or a Scam?
WikiFXInflation gauge held sticky at 3% as U.S. headed into war with Iran, key Fed gauge shows
WikiFXCurrency Calculator
USD

CNY
Current Rate:0
Enter amount
USD
Redeemable Amount
CNY
Calculate 