Abstract:The Nikkei 225 dropped alongside Nintendo shares. The ASX 200 may be topping on bearish technical signals. Declines in equities may be ahead after Asia Pacific stocks mostly sunk.
Asia Pacific Markets Talking Points
Equities mostly sink in Asia as trade war fears overshadow dovish Fed bets
S&P 500 futures hint further pessimism to come ahead as anti-risk Yen gains
ASX 200 may top given bearish technical signals despite RBA rate cut bets
Find out what retail traders equities buy and sell decisions say about the coming price trend!
Pessimism from Wall Street echoed into Thursdays Asia Pacific trading session, with most regional bourses aiming lower. Softer-than-expected US inflation data, which fueled more dovish Fed monetary policy expectations, did little to distract traders from the threat of trade tensions between Washington and Beijing.
The Nikkei 225, Japans benchmark stock index, traded about 0.6 percent lower heading into the close. Information technology shares underperformed, and video game maker Nintendo slumped.
Australias ASX 200 was close to little changed as it was offered some relief by rising expectations of a cut from the Reserve Bank of Australia, again. A lackluster employment report sent local front-end government bond yields falling, with the 3-year dropping below one percent for the first time on record.
In Hong Kong, the Hang Seng Index slumped about 0.9%, extending declines from yesterday as extradition protests continued and as one-month HIBOR climbed to its highest since 2008. USD/HKD has seen aggressive declines as of late after flirting with the HKMAs weak-side convertibility undertaking.
S&P 500 futures are pointing decisively lower, hinting that risk aversion may prevail over the remaining 24 hours. As such, the anti-risk Japanese Yen may extend gains as Wall Street gaps lower. This would pose to bode ill for the pro-risk Australian and New Zealand Dollars, which are already lower.
ASX 200 Technical Analysis
Taking a closer look at the ASX 200, the index recently left behind a Shooting Star candlestick, which is a sign of indecision. Meanwhile, negative RSI divergence warns that upside momentum is fading. As such, technical signals are warning of a top that could be in the making. For medium-term conviction, keep an eye on the rising channel of support going back to February on the chart below.
ASX 200 Daily Chart
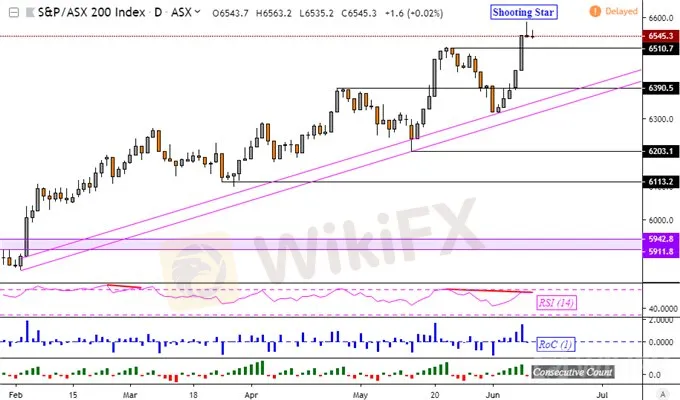
Chart Created in TradingView


