简体中文
繁體中文
English
Pусский
日本語
ภาษาไทย
Tiếng Việt
Bahasa Indonesia
Español
हिन्दी
Filippiiniläinen
Français
Deutsch
Português
Türkçe
한국어
العربية
Gold Price Forecast: Will a Double Bottom Pattern Spark Price Gains?
Abstract:Gold Price Forecast: Will a Double Bottom Pattern Spark Price Gains?
GOLD PRICE FORECAST:
Gold remains locked in a descending channel from its August highs but losses have slowed
A double bottom trading pattern, typically viewed as bullish, has formed and could spark gains
Bitcoin vs Gold: Top Differences Traders Should Know
GOLD PRICE FORECAST: WILL A DOUBLE BOTTOM PATTERN SPARK PRICE GAINS?
Gold suffered significant declines in late February and early March as US Treasury yields grinded higher. Losses saw XAU/USD blow through various levels of technical support until the lower bound of the metals descending channel helped to arrest declines around the $1,675 mark. A picture-perfect bounce off the trendline and subsequent bounce off a nearby Fibonacci level has seen gold recover somewhat and recent price action has formed a double bottom technical pattern as a result.
GOLD (XAU/USD) PRICE CHART: DAILY TIME FRAME (NOVEMBER 2019 - APRIL 2021)
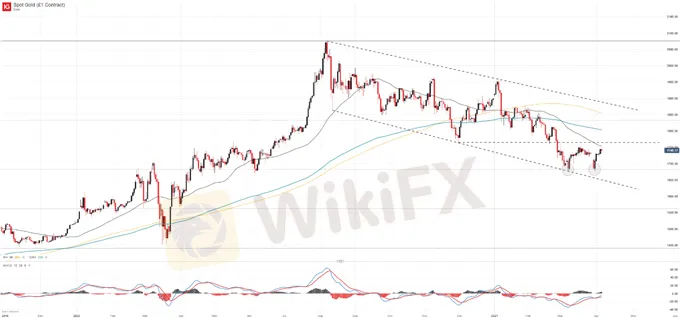
Generally viewed as a formation that precedes bullish price action, the recent double bottom pattern could hint gold may look to continue higher in the days ahead. Fundamental concerns remain to be sure, but a recent lack of progress in US Treasury yields and US Dollar weakness has opened the door for gold to recoup some losses. Still, despite the potentially bullish technical pattern, there is little to suggest the broader downtrend will be snapped.
Nevertheless, the pattern could allow for range trading opportunities. Initial resistance in the event of a continuation higher resides around the $1,765 mark which coincides with the metals November 2020 low. Should gold drive through early resistance, $1,800 may materialize as a secondary barrier.
A move to $1,800 would see gold successfully retake the midpoint of the descending channel where it could then take aim at a series of moving averages overhead. Either way, conviction will be required to fulfill the double bottom pattern, so a sizable move through the $1,765 would be an encouraging sign at this stage.
GOLD (XAU/USD) PRICE CHART: 4 – HOUR TIME FRAME (AUGUST 2020 - MARCH 2021)
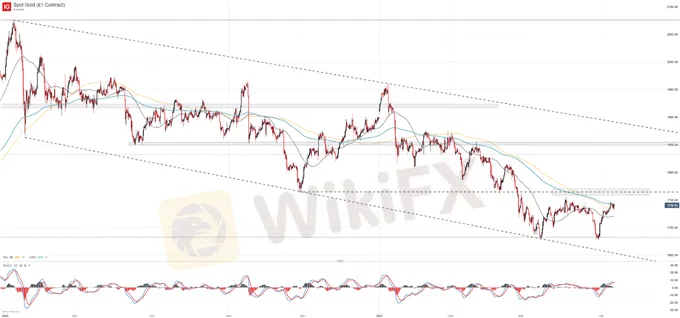
Although gold bulls may look to capitalize on the technical pattern and relatively accommodative fundamental backdrop, traders should continue to monitor the US 10-year Treasury yield. Rising yields have been a source of weakness for gold and if yields climb further, gold might enter another stage of weakness and seek support – despite technical patterns that might hint otherwise.
While XAU/USD looks to recover from months of declines, the gold miners ETF, GDX, has taken aim at the topside of an unsurprisingly similar descending channel. To that end, the fund tracks the stock price of companies that generate their revenue from gold. Thus, higher gold prices translate to higher profits for the miners which is then reflected in the price of GDX.
GOLD MINERS FUND (GDX) PRICE CHART: DAILY TIME FRAME (MARCH 2020 – APRIL 2021)
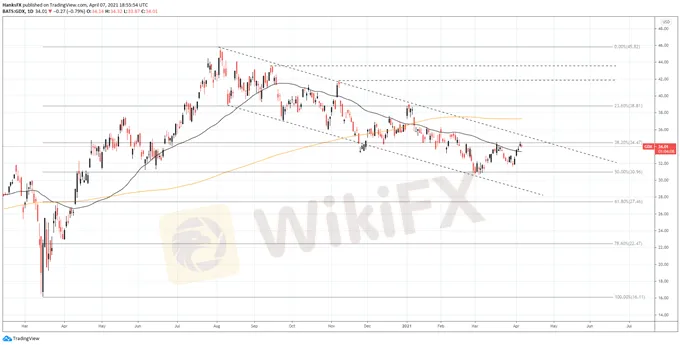
In general, the gold miners fund experiences greater volatility than its metal counterpart and its ascent to the top of its trading range while gold languishes beneath is somewhat indicative of that dynamic. While GDX typically offers little indication of future gold prices, its heightened volatility may give rise to a break higher in the fund if gold prices continue to rise modestly – something to consider for traders in search of price action. That said, volatility is a double edged sword so losses could accelerate more quickly if gold turns lower once more.
----------------
WikiFX, the world's No.1 broker inquiry platform!
Use WikiFX to get free trading strategies, scam alerts, and experts experience!
Android : cutt.ly/Bkn0jKJ
iOS : cutt.ly/ekn0yOC

Disclaimer:
The views in this article only represent the author's personal views, and do not constitute investment advice on this platform. This platform does not guarantee the accuracy, completeness and timeliness of the information in the article, and will not be liable for any loss caused by the use of or reliance on the information in the article.
Read more

Celebrating Excellence of Easy Trading Online at 2024 FastBull Awards Ceremony
On the evening of April 28, Easy Trading Online proudly received the 'Most Trusted Forex Broker' award at the BrokersView 2024, hosted by Fastbull. This accolade is a testament to our steadfast dedication to providing reliable and superior trading services in the forex and CFD brokerage industry.

Easy Trading Online Shines as Gold Sponsor at BrokersView Expo Dubai 2024
The BrokersView Expo Dubai 2024 is a premier event in the financial industry, bringing together top financial institutions, brokers, and technology providers from around the globe. As the Gold Sponsor of BrokersView Expo Dubai 2024, Easy Trading Online took the opportunity to showcase our latest products, service technologies, and core competitive advantages in the forex trading field.

Easy Trading Online at the Wiki Gala Night
On the 23rd of March, the Easy Trading Online family had the distinguished pleasure of being the Table Sponsor at the prestigious Wiki Gala Night. As we reflect on the event, it’s with a sense of pride and joy that we share the highlights and our takeaways from an evening that was as inspiring as it was splendid.

Explore Easy Trading Online - Discover the World’s Leading Forex Trading Platform
Easy Trading Online Broker Proud to be a trusted Forex trading platform. Fulfilling all the mentioned criteria, we provide: A trading platform that is easy to use and understand. Advanced market analysis tools To help you keep track of market changes and make effective trading decisions. Competitive trading fees It will help you save on your expenses. Professional customer support team Always available to advise when in doubt 24/7.
WikiFX Broker
Latest News
FCA bans and fines James Lewis £120,300 for putting investors at risk
BSP Approves Coins.ph to Launch Peso Stablecoin
Exploring Swing Trading vs Scalping: A Strategy Comparison
Oppenheimer & Co. Fined $500K for Supervision Lapses
FCAA Warns Against Morgan Stern
Robinhood to Fight SEC Over Crypto Business in Court
Scope Markets Boosts UAE Offer with 23 New Dubai Stocks CFDs
FCA Warns Against CryptosMarket
FCA Warns Against SolidusMarkets
INFINOX Leads the Financial Sector with Green Initiatives
Currency Calculator

