简体中文
繁體中文
English
Pусский
日本語
ภาษาไทย
Tiếng Việt
Bahasa Indonesia
Español
हिन्दी
Filippiiniläinen
Français
Deutsch
Português
Türkçe
한국어
العربية
GBPUSD analysis for 25.10.2023
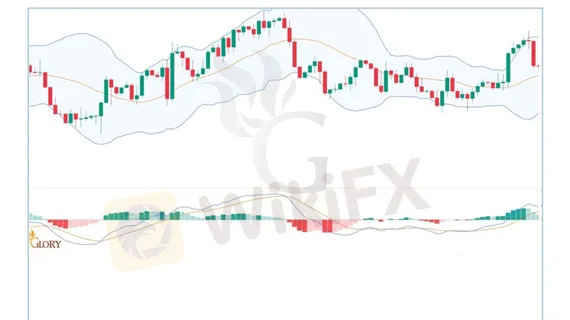
Zusammenfassung:The GBPUSD chart indicates positive upward momentum as it shows a recent rebound from the lower Bollinger Band and is now moving towards the upper band. These observations suggest a possible bullish trend in the price movement.

The GBPUSD chart indicates positive upward momentum as it shows a recent rebound from the lower Bollinger Band and is now moving towards the upper band. These observations suggest a possible bullish trend in the price movement.
Moreover, the MACD demonstrates a bullish crossover, with the MACD line surpassing the signal line, reinforcing the upward momentum. The histogram turning positive further supports this bullish sentiment. Traders should monitor for potential resistance at the upper Bollinger Band.
• There is a resistance level at 1.22878; followed by resistance at 1.24243 and 1.27392.
• There is a support level at 1.20380 Below, there are 1.20952 and 1.21603.

Haftungsausschluss:
Die Ansichten in diesem Artikel stellen nur die persönlichen Ansichten des Autors dar und stellen keine Anlageberatung der Plattform dar. Diese Plattform übernimmt keine Garantie für die Richtigkeit, Vollständigkeit und Aktualität der Artikelinformationen und haftet auch nicht für Verluste, die durch die Nutzung oder das Vertrauen der Artikelinformationen verursacht werden.
Verbundener Broker
WikiFX-Broker
FP Markets
IG
SECURETRADE
TVR
HK Fortune
OSIRIS FOREX
FP Markets
IG
SECURETRADE
TVR
HK Fortune
OSIRIS FOREX
WikiFX-Broker
FP Markets
IG
SECURETRADE
TVR
HK Fortune
OSIRIS FOREX
FP Markets
IG
SECURETRADE
TVR
HK Fortune
OSIRIS FOREX
Aktuelle Nachrichten
FTX reicht konsensbasierten Reorganisationsplan ein und wartet auf die Genehmigung des Konkursgerichts
Sparkurs und neuer Chef bei Gamesa: So saniert Siemens Energy sein angeschlagenes Windkraftgeschäft
SEC vs Ripple Prozess wird geschwärztes Dokument veröffentlicht, XRP sinkt auf $0,51
Die Trauerfeier für die Shopify Aktie
Immer mehr Deutsche kaufen zum ersten Mal Gold – doch dieses Land treibt den Preis in die Höhe
Diese vier großen Faktoren an der Börse solltet ihr beobachten – sie können zu Turbulenzen führen
UBS-Stratege erwartet Gewinnanstieg: 5 Bereiche, in die Anleger jetzt investieren sollten
Warren Buffetts Tanz mit Apple: Ein Blick auf das Berkshire Hathaway Portfolio
Die Aktie des Bitcoin-Miners Marathon Digital gewinnt nach der Notierung durch S&P Global an Boden
Aristas Quartalszahlen: Die Tech-Achterbahn
Wechselkursberechnung

