

Broker Globale Piattaforma di Verifica Regolamentare
WikiFX
Italiano
简体中文
繁體中文
English
Pусский
日本語
ภาษาไทย
Tiếng Việt
Bahasa Indonesia
Español
हिन्दी
Filippiiniläinen
Français
Deutsch
Português
Türkçe
한국어
العربية
اردو
FPG XAUUSD Market Report June 19, 2026
Sommario:On the H1 timeframe chart, XAUUSD (Gold) has continued its bearish structure with a sustained downside move. Price declined sharply from the 4,381 swing to 4,219, followed by a brief corrective reboun
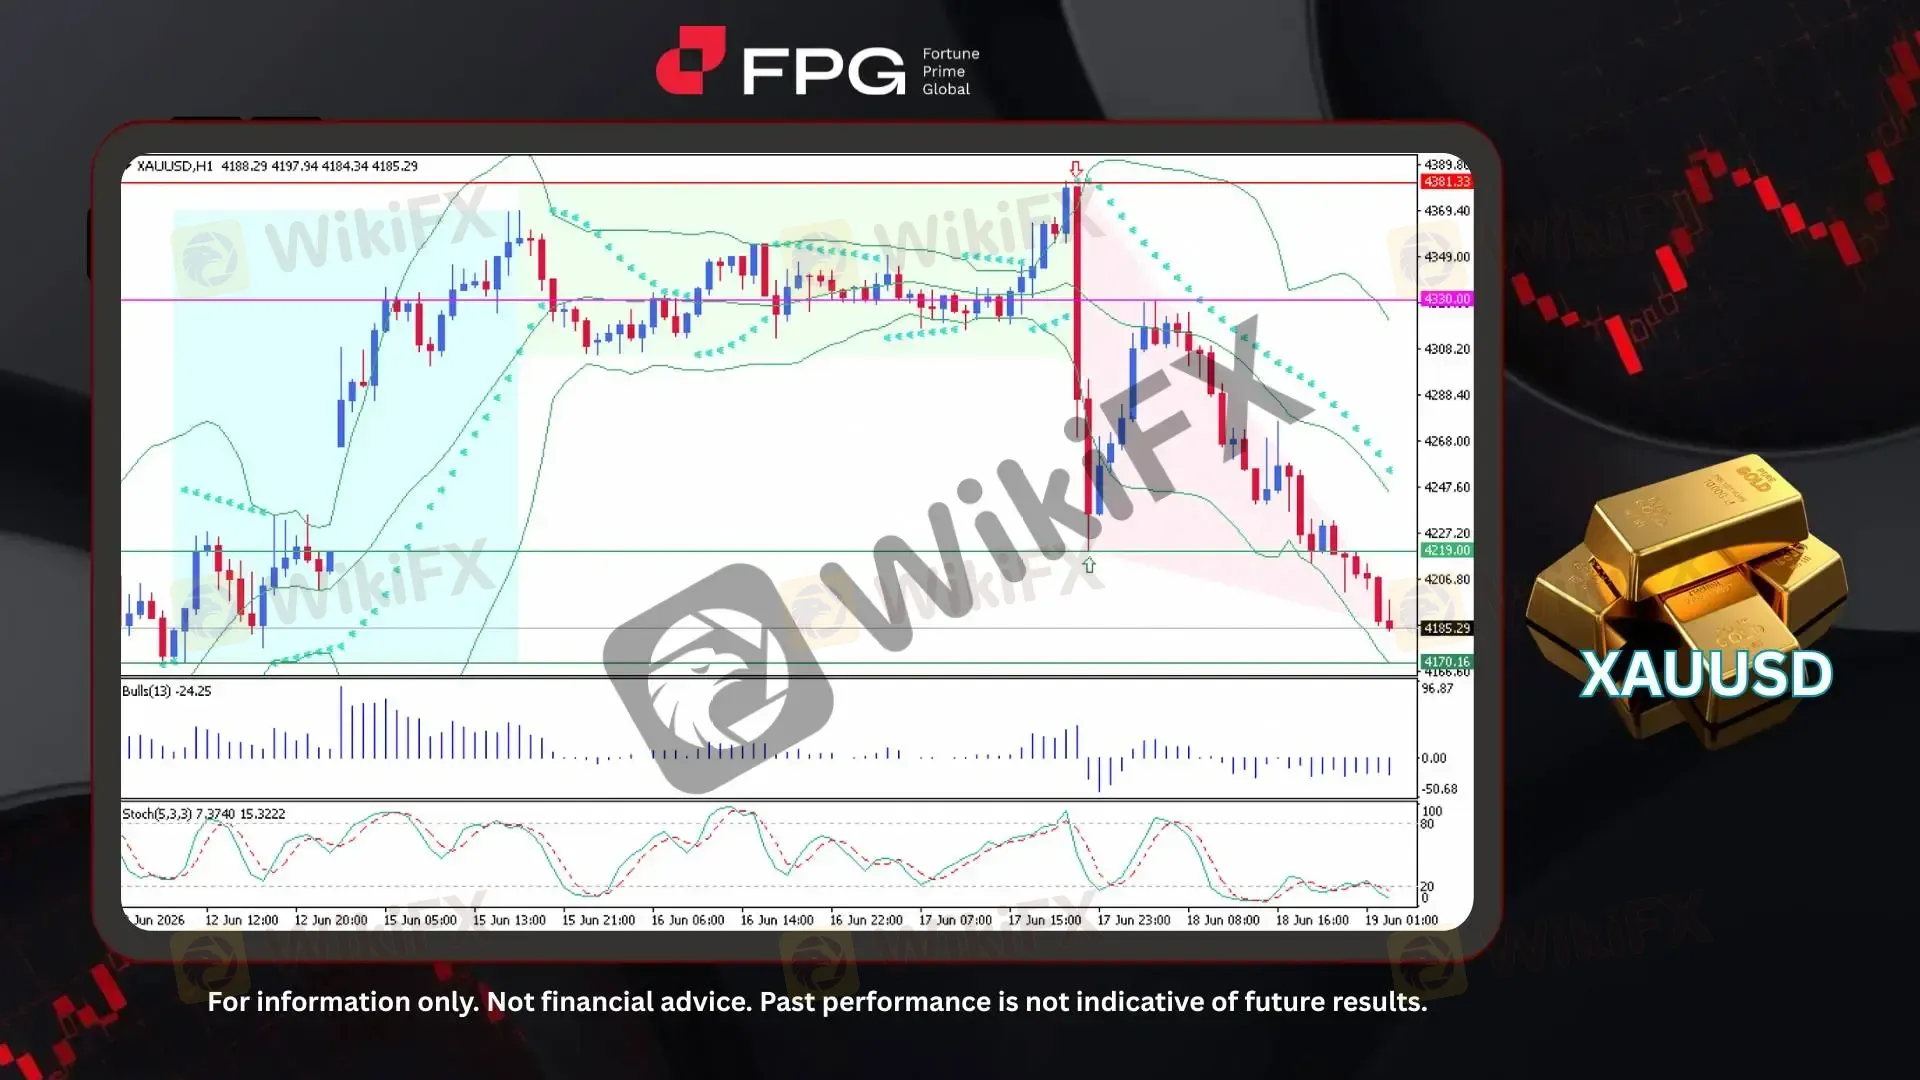
On the H1 timeframe chart, XAUUSD (Gold) has continued its bearish structure with a sustained downside move. Price declined sharply from the 4,381 swing to 4,219, followed by a brief corrective rebound toward 4,330 before resuming its bearish trajectory toward the 4,185 area. The latest price action reflects continued selling pressure, marking a total decline of approximately 4.5% over the past two days. At the time of writing, gold is trading around 4,185, with volatility remaining elevated as shown by the recent sharp directional swings.
From a technical perspective, the Bollinger Bands remain significantly expanded, indicating sustained high volatility and an active trending environment rather than consolidation. Price continues to trade along the lower band region, reinforcing bearish pressure. In addition, the Parabolic SAR dots remain positioned above the candles, confirming that downside momentum is still dominant. Oscillator readings, including stochastic behavior near the lower region, also suggest weak recovery attempts and continued bearish control despite minor intraday pullbacks.
Fundamentally, the Federal Reserves decision to maintain interest rates alongside a hawkish dot plot has strengthened the U.S. Dollar and reinforced expectations of prolonged higher interest rates. This environment continues to weigh on non-yielding assets such as gold. At the same time, easing geopolitical tensions in the Middle East, expectations surrounding the reopening of key shipping routes, and declining crude oil prices have reduced safe-haven demand. Combined with resilient U.S. economic data and rising Treasury yields, the opportunity cost of holding gold has increased, resulting in sustained downside pressure on XAUUSD as dollar strength and yield dynamics continue to dominate sentiment.
Technical Market Overview
1. Current Position: XAUUSD is in a strong bearish continuation phase on the H1 timeframe, extending its decline after rejection from the 4,381 swing high. Price is currently trading around 4,185 and market structure remains bearish with a clear sequence of lower highs and lower lows.
2. Resistance Zone: Immediate resistance is seen at 4,219, which aligns with the recent breakdown level and now acts as minor intraday resistance. Above that, 4,330 represents a resistance, followed by 4,381 as the major swing high and strong supply zone.
3. Support Zone: Immediate support is located at 4,170, acting as a short-term psychological level for price reaction. Below that, 4,150 serves as a local demand area, with 4,100 as the next structural support if bearish continuation persists.
4. Indicator Observation: Bollinger Bands remain widely expanded, indicating elevated volatility and a strong trending environment to the downside. Price is hugging the lower band while Parabolic SAR dots stay above price, reinforcing continued bearish momentum, and stochastic remains oversold with only weak recovery signals.
5. Technical Summary: Overall structure remains decisively bearish following rejection from 4,381. Momentum and volatility indicators continue to support downside continuation, with no strong reversal signals currently in play, unless price manages to reclaim the 4,330–4,350 area, which would be required to shift short-term sentiment back toward a neutral or corrective bullish bias.
Market Performance:
Precious Metals Last Price % Change
XPTUSD 1,667.78 −1.15%
XAGUSD 65.1125 −0.92%
Key Economic Calendar:
US: Net Long-term TIC Flows
UK: Gfk Consumer Confidence
JP: Inflation Rate & Core Inflation Rate YoY
JP: BoJ Monetary Policy Meeting Minutes
DE: PPI YoY
UK: Retail Sales MoM & YoY
EU: European Council Meeting
CA: Retail Sales Ex Autos MoM
CA: Retail Sales MoM Final & Preliminary
Risk Disclaimer: This report is for informational purposes only and does not constitute financial advice. Investments involve risks, and past performance does not guarantee future results. Consult your financial advisor for personalized investment strategies.
Disclaimer:
Le opinioni di questo articolo rappresentano solo le opinioni personali dell’autore e non costituiscono consulenza in materia di investimenti per questa piattaforma. La piattaforma non garantisce l’accuratezza, la completezza e la tempestività delle informazioni relative all’articolo, né è responsabile delle perdite causate dall’uso o dall’affidamento delle informazioni relative all’articolo.
WikiFX Trader
FxPro
Sotto supervisione
Exness
Sotto supervisione
FOREX.com
Supervisione del paese
JustMarkets
Sotto supervisione
GTCFX
Sotto supervisione
eightcap
Sotto supervisione
FxPro
Sotto supervisione
Exness
Sotto supervisione
FOREX.com
Supervisione del paese
JustMarkets
Sotto supervisione
GTCFX
Sotto supervisione
eightcap
Sotto supervisione
Rate Calc
USD

CNY
Tasso di cambio attuale:0
inserisci l'importo
USD
A disposizione
CNY
Calcolare 