
Broker Globale Piattaforma di Verifica Regolamentare
WikiFX
Italiano
简体中文
繁體中文
English
Pусский
日本語
ภาษาไทย
Tiếng Việt
Bahasa Indonesia
Español
हिन्दी
Filippiiniläinen
Français
Deutsch
Português
Türkçe
한국어
العربية
اردو

FPG USTEC Market Report April 16, 2026
Sommario:USTEC (Nasdaq-100) on the H1 timeframe chart is currently forming a new All-Time High, with the latest peak recorded around 26,262. There remains potential for another new All-Time High to be establis
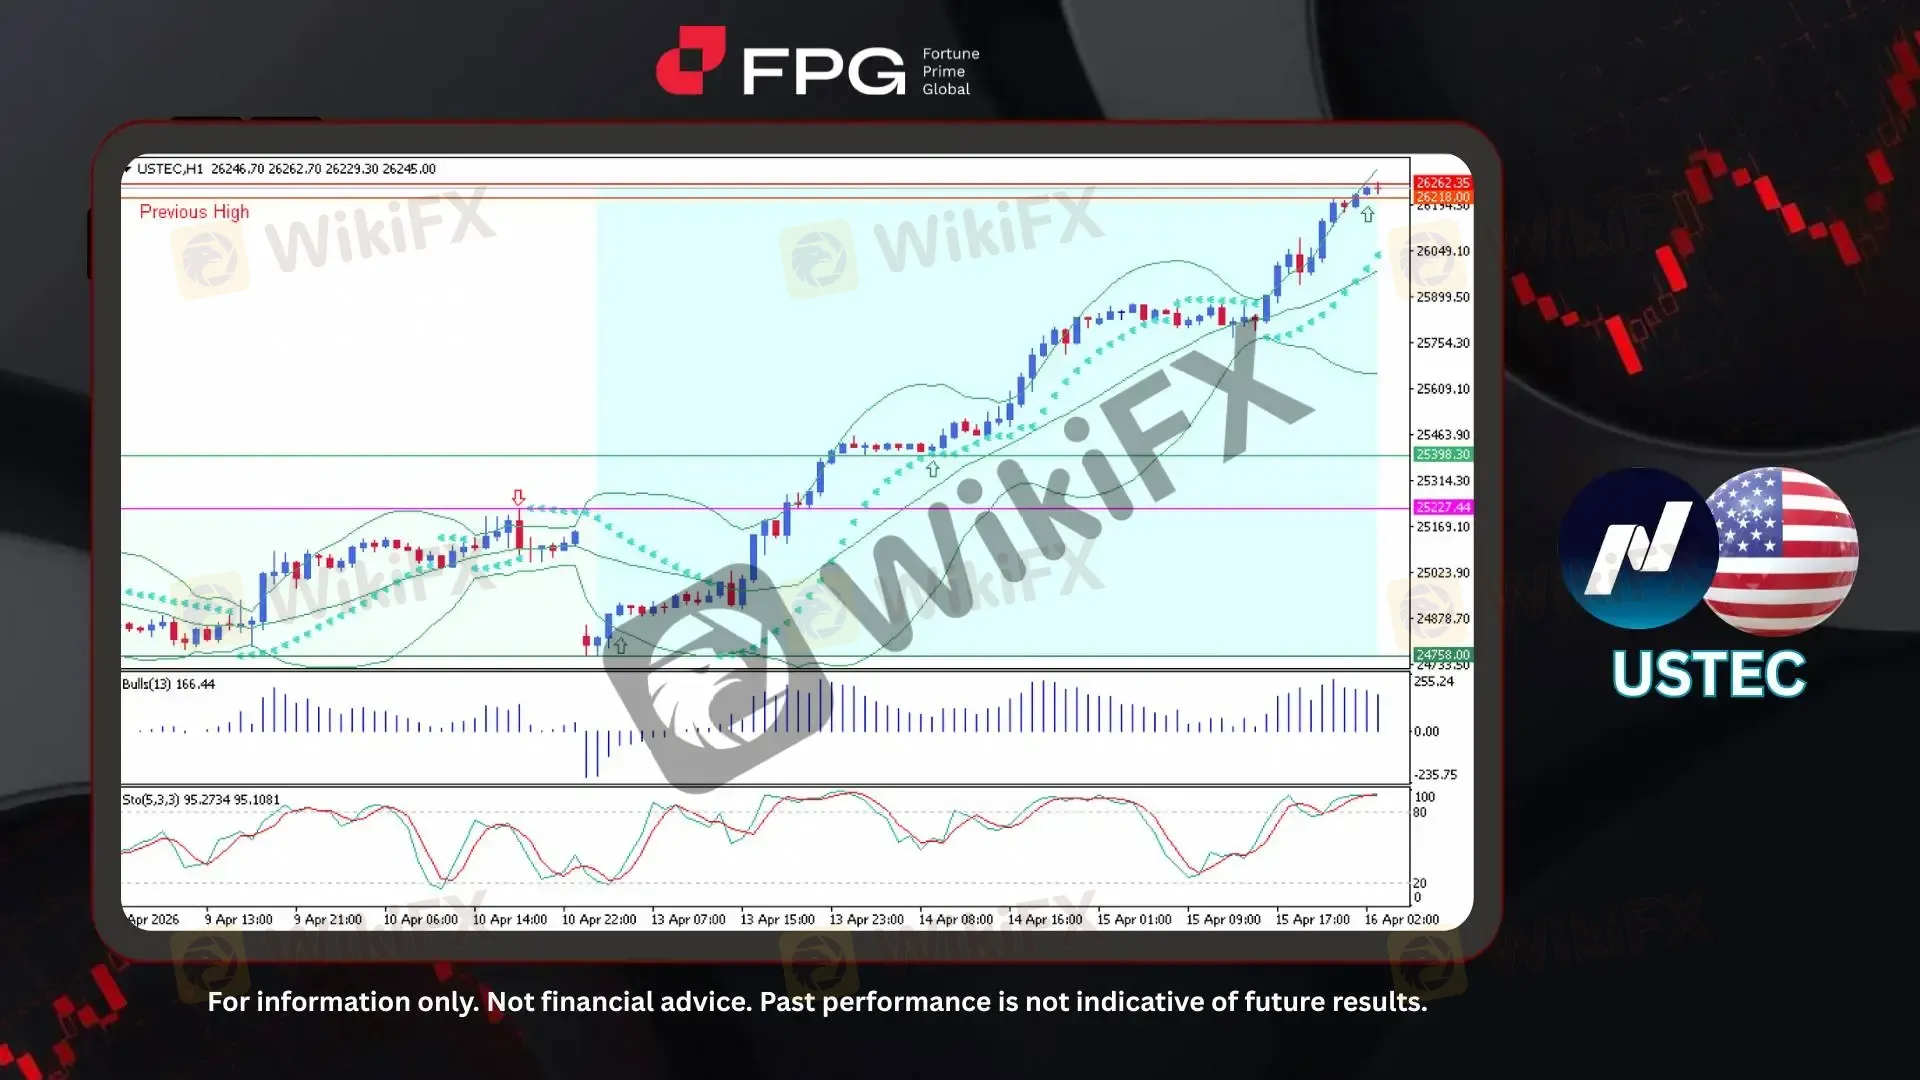
USTEC (Nasdaq-100) on the H1 timeframe chart is currently forming a new All-Time High, with the latest peak recorded around 26,262. There remains potential for another new All-Time High to be established in the near term. The previous high from January stood at 26,218, which has now been successfully broken, confirming a bullish continuation. This rally initially began from 24,758 and has shown consistent upward momentum up to 26,262. The current price is trading around 26,245, positioned very close to both the recent high at 26,262 and the previous high at 26,218. Market volatility remains extremely high, increasing the likelihood of another All-Time High being formed.
From a technical indicator perspective, price action remains strongly bullish, consistently trading above the middle line of the Bollinger Bands and recently pushing toward the upper band, indicating strong upward momentum and expansion in volatility. The Parabolic SAR dots are positioned below the candles, confirming a sustained bullish trend with no immediate reversal signals observed. The Bulls Power indicator remains in positive territory and shows increasing histogram strength, reflecting strong buying pressure dominating the market. Meanwhile, the Stochastic Oscillator is hovering in the overbought zone, signaling that although bullish momentum is still intact, the market is entering a stretched condition and may be prone to short-term pullbacks or consolidation. Overall, the combination of these indicators supports a continuation bias, but with heightened risk due to overextended conditions.
Recent coverage highlights a strong bullish phase in the US tech index, with fresh all-time highs driven by renewed investor appetite for technology stocks and AI-led growth momentum. Major outlets note that easing geopolitical tensions and improving earnings expectations have fueled aggressive buying, pushing prices into record territory while reinforcing a broader risk-on sentiment across global markets. Analysts also emphasize that the rally remains technically strong but increasingly stretched, with volatility rising as traders react to macro catalysts, positioning shifts, and rapid price expansion. Despite the continued upside momentum, the combination of record highs and fast-paced gains signals unstable price action, and traders are advised to remain cautious due to extremely high volatility.
Technical Market Overview
1. Current Position: USTEC (Nasdaq-100) is currently trading around 26,245, maintaining a strong bullish structure after successfully breaking above the previous high at 26,218.
2. Resistance Zone: The nearest resistance is located at 26,262, which marks the latest All-Time High.
3. Support Zone: Immediate support is seen at 26,218, representing the previous high and current breakout level. A deeper support zone is located around 25,398, which aligns with a recent consolidation area and dynamic support from the trend structure.
4. Indicator Observation: Technical indicators continue to support the bullish outlook. Price is trading near the upper Bollinger Band, signaling strong momentum and increased volatility. The Parabolic SAR remains below the candles, confirming an ongoing uptrend. Bulls Power is in positive territory, reflecting strong buying pressure. However, the Stochastic Oscillator is in the overbought zone, indicating a potentially stretched market condition and the possibility of short-term pullbacks or consolidation.
5. Technical Summary: Overall, USTEC remains in a strong bullish trend with momentum favoring further upside. However, the combination of overbought conditions and elevated volatility suggests that while new highs are possible, price action may become unstable. Traders should monitor for breakout confirmation above resistance or potential short-term retracements toward support levels before continuation.
Market Performance:
Indices Last Price % Change
US500 7,031.6 +0.18%
US30 48,537 +0.10%
Today's Key Economic Calendar:
US: Fed Bowman Speech
UK: BoE Gov Bailey Speech
EU: ECB President Lagarde Speech
US: Net Long-term TIC Flows
AU: Employment & Full Time Employment Change
CN: House Price Index YoY
AU: Unemployment Rate
CN: Fixed Asset Investment (YTD) YoY
CN: GDP Growth Rate QoQ & YoY
CN: Industrial Production YoY
CN: Retail Sales YoY
UK: GDP 3-Month Avg & GDP MoM
UK: Goods Trade Balance & Non-EU
UK: Industrial & Manufacturing Production MoM
CN: FDI (YTD) YoY
EU: ECB Monetary Policy Meeting Accounts
US: Initial Jobless Claims
US: Philadelphia Fed Manufacturing Index
US: Fed Williams Speech
US: Industrial Production MoM
US: Fed Miran Speech
Risk Disclaimer: This report is for informational purposes only and does not constitute financial advice. Investments involve risks, and past performance does not guarantee future results. Consult your financial advisor for personalized investment strategies.
Disclaimer:
Le opinioni di questo articolo rappresentano solo le opinioni personali dell’autore e non costituiscono consulenza in materia di investimenti per questa piattaforma. La piattaforma non garantisce l’accuratezza, la completezza e la tempestività delle informazioni relative all’articolo, né è responsabile delle perdite causate dall’uso o dall’affidamento delle informazioni relative all’articolo.
WikiFX Trader
WikiFX Trader
Rate Calc
USD

CNY
Tasso di cambio attuale:0
inserisci l'importo
USD
A disposizione
CNY
Calcolare 