
Broker Globale Piattaforma di Verifica Regolamentare
WikiFX
Italiano
简体中文
繁體中文
English
Pусский
日本語
ภาษาไทย
Tiếng Việt
Bahasa Indonesia
Español
हिन्दी
Filippiiniläinen
Français
Deutsch
Português
Türkçe
한국어
العربية
اردو
DBG Markets | Is the Bottom In? Identifying Market Reversals with the Double Bottom Pattern
Sommario:Is the Bottom In? Identifying Market Reversals with the Double Bottom PatternRecent equity markets—whether in the U.S. or Europe—see broad indices sliding, the same question inevitably arises: “Is it
Is the Bottom In? Identifying Market Reversals with the Double Bottom Pattern
Recent equity markets—whether in the U.S. or Europe—see broad indices sliding, the same question inevitably arises: “Is it time to buy?” For many, the urge to “buy the dip” is strong, but without a plan, you risk catching a falling knife.
Beyond fundamental factors, chart pattern analysis is a powerful way to identify a true floor. Among these, the Double Bottom is one of the most reliable technical signals for spotting a potential trend reversal.
In this following article, DBG Markets explains how to use this pattern to navigate market bottoms with precision.
1. What is Double Bottom Pattern?
The Double Bottom is a bullish reversal chart formation that typically appears after a prolonged downtrend. It signals that the selling pressure has exhausted itself and that the market is preparing to shift into a bullish trend.
While highly regarded in the stock market for spotting major index bottoms, its utility isn't limited to equities. It is a universal technical tool applied across Forex, Commodities, Cryptocurrencies, and Futures. It is the direct counterpart to the Double Top, which signifies a bearish reversal.
2. Double Bottom Formation and Meaning
Often referred to as the “W Bottom” due to its resemblance to the letter “W,” this pattern is relatively easy to identify. It consists of two distinct troughs:
· Left shoulder or left bottom
· Right shoulder or right bottom
Overall, it represents a bullish reversal signal in the market, and here is how we can interpret the meaning of the double bottom pattern:
2.1. Left Shoulder or Bottom
The left bottom is the initial low. After a long decline, the market hits a price floor and experiences a relief rally (rebound). However, the upside momentum fails to sustain, leading to a second wave of selling.
2.2. Right Shoulder or Bottom
Following the failed rebound, the market declines again toward the area of the previous low. Crucially, the bears fail to push the price significantly lower than the first bottom. As buyers step in again, the market regains strength and surges toward the previous high of the initial rebound.
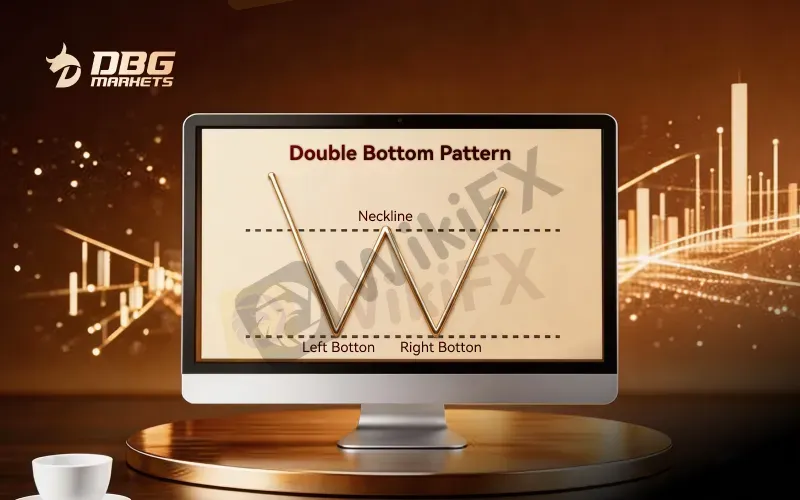
3. The Double Bottom Neckline
The double bottom neckline is the crucial part to identify and applying the double bottom trading strategy. The neckline primarily serves three functions:
3.1. Double bottom pattern confirmation
The neckline serves as a resistance level before the formation. Only when the price breaks through the neckline resistance, the double bottom can be confirmed. At this point, the neckline assumes the role of support level.
3.2. Double bottom pattern entry
Like all chart pattern with a neckline, once the confirmation of the bottom is validated through the neckline, the entry of double bottom pattern can be determined by the neckline. We will further explain this in the following section later this article.
3.3. Double bottom pattern price
Neckline is also the key elements in calculating the price target of double bottom pattern. After the pattern confirmed through breaking above the neckline, the minimum price target is determined by the distance from the low to the neckline of the pattern.
3.4 Market Psychology
From a morphological perspective, the formation of the double bottom and its neckline reflects a profound evolution in market participant psychology:
1. Bulls Stepping In (The Double Bottom): When the price stabilizes at the same level twice, it indicates that buyers (bulls) are actively entering at low levels. However, they have not yet seized full control, as the bears (sellers) still have enough strength to fight back.
2. The Decisive Battle (Challenging the Neckline): As the price returns to the neckline, it represents the final line of defense for the bears. This is the ultimate “tug-of-war” for trend direction.
3. Bulls Seizing Control (The Breakout): Once the neckline—the previous stronghold of resistance—is shattered, it marks the moment the bulls have officially stripped control from the bears. At this point, market consensus aligns, and a bullish reversal shifts from a “possibility” to a “high-probability” event.
DBG Markets Tip: Watching the trading volume during the neckline breakout provides extra confidence. A breakout accompanied by a surge in volume typically indicates that the momentum behind the trend reversal is significantly stronger.

Disclaimer:
Le opinioni di questo articolo rappresentano solo le opinioni personali dell’autore e non costituiscono consulenza in materia di investimenti per questa piattaforma. La piattaforma non garantisce l’accuratezza, la completezza e la tempestività delle informazioni relative all’articolo, né è responsabile delle perdite causate dall’uso o dall’affidamento delle informazioni relative all’articolo.
WikiFX Trader
GTCFX
Sotto supervisione
JustMarkets
Sotto supervisione
vantage
Sotto supervisione
STARTRADER
Sotto supervisione
AVATRADE
Sotto supervisione
Exness
Sotto supervisione
GTCFX
Sotto supervisione
JustMarkets
Sotto supervisione
vantage
Sotto supervisione
STARTRADER
Sotto supervisione
AVATRADE
Sotto supervisione
Exness
Sotto supervisione
Rate Calc
USD

CNY
Tasso di cambio attuale:0
inserisci l'importo
USD
A disposizione
CNY
Calcolare 