
Broker Globale Piattaforma di Verifica Regolamentare
WikiFX
Italiano
简体中文
繁體中文
English
Pусский
日本語
ภาษาไทย
Tiếng Việt
Bahasa Indonesia
Español
हिन्दी
Filippiiniläinen
Français
Deutsch
Português
Türkçe
한국어
العربية
اردو
DBG Markets: Market Report for Mar 25, 2026
Sommario:Risk Sentiment Shift on Ceasefire Hopes;Oil, EURUSD, Gold Bitcoin OutlookThe global financial markets are experiencing a sudden shift in momentum today. Reports of potential ceasefire talks have inje

Risk Sentiment Shift on Ceasefire Hopes;Oil, EURUSD, Gold & Bitcoin Outlook
The global financial markets are experiencing a sudden shift in momentum today. Reports of potential ceasefire talks have injected hopes of a temporary sentiment recovery into the market. This geopolitical de-escalation is acting as a massive pressure release valve, triggering sharp corrective moves across commodities and the currency space.
US-Iran Ceasefire Hopes: Will Oil Face a Deeper Correction?
The explosive "war premium" that recently drove crude oil to test the $119 per barrel mark is rapidly deflating. Following news of potential ceasefire talks between the US and Iran, energy markets experienced a sharp, sudden pullback, bringing Brent Crude (UKOIL) back down toward the $100.00 psychological level.
Reports indicate that the US has sent a 15-point plan to Iran seeking a 30-day ceasefire. US-Iran high-level talks are expected on Thursday, pending confirmation from Iran, despite initial denials. The prospect of a ceasefire is shifting market sentiment rapidly from risk-off to risk-on.
Whats Next for Oil?
Although the broader fundamental reality remains heavily constrained—as the Strait of Hormuz remains effectively blocked—the immediate threat of supply destruction has been paused. This opens the door for a near-term technical correction. Expect elevated volatility as oil digests this ceasefire news.
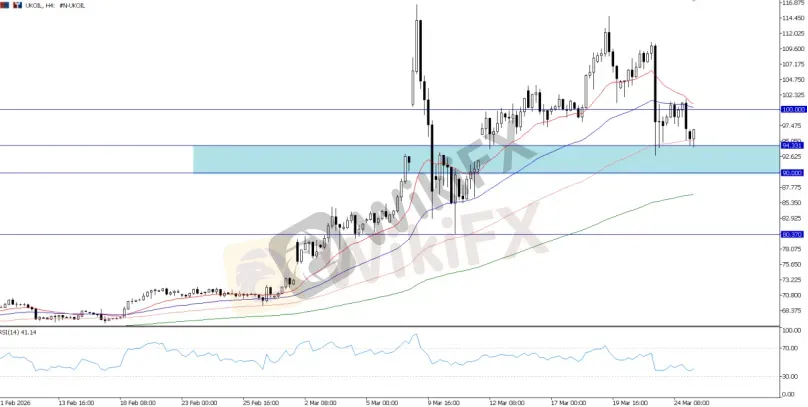
UKOIL, H4 Chart
Technically, with UKOIL breaking below the $100 mark, it suggests that buying momentum has faded as the risk premium eases. If we see a decisive break below $94, it could trigger a deeper corrective wave toward $90 or lower.
However, the outlook remains volatile due to lingering uncertainty. In the near term, watch if $100 holds as resistance, which would confirm the corrective wave, while $90 remains the major structural support.
US Dollar: Safe-Haven Unwinding
The sharp pullback in oil prices is creating a direct ripple effect in the currency markets. The US Dollar Index (DXY) is facing a technical rejection at its monumental 100.00 liquidity ceiling, and the current unwinding of safe-haven positions could potentially cap the Dollar's upside.
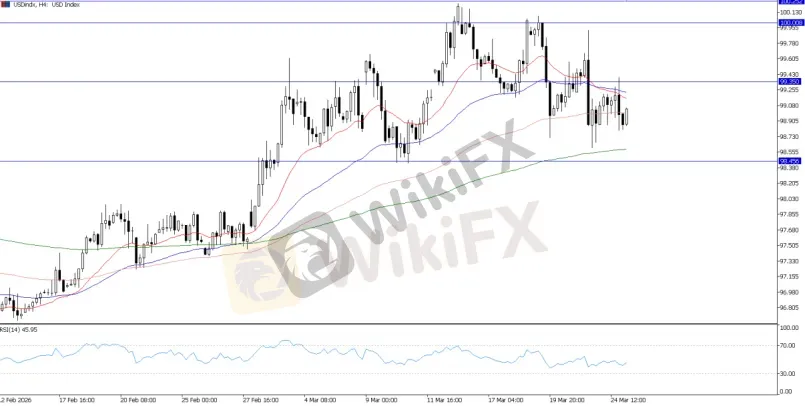
USD Index, H4 Chart
For the US Dollar, continued trading below the 99.35 pivot we covered earlier suggests the Greenback is undergoing further pressure.
If near-term risk sentiment continues to recover on eased Middle East tensions, the Dollar's safe-haven appeal may rapidly unwind. While downside moves remain supported by the 98.50 level, the index is likely to remain in a pressured consolidation phase.
EURUSD Reversal Setup?
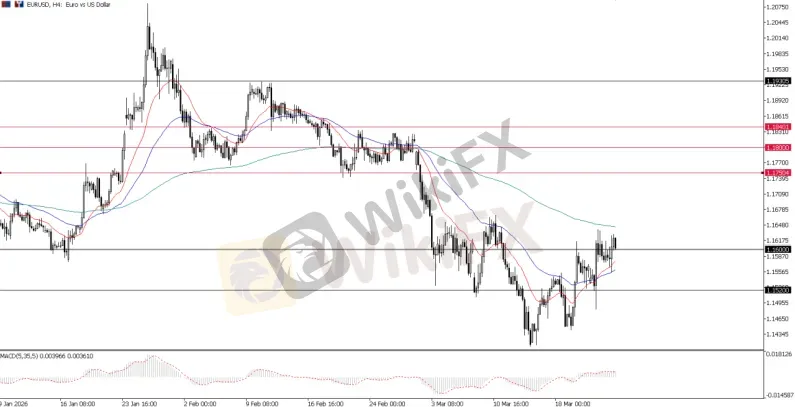
URUSD, H4 Chart
Turning to EURUSD, a weakening Dollar would provide the exact catalyst needed for a recent reversal setup. Technically, EURUSD has formed a potential reversal pattern, successfully regaining ground above the 1.1600 level.
In the near term, if we see continued support above 1.1600, this could set the stage for a confirmed EURUSD reversal, with the pair likely seeing a further leg up toward the 1.1750 area.
Gold (XAUUSD): Is the Bottom Finally In?
Meanwhile, the precious metals market has suffered a historic bloodbath recently. The toxic combination of zero projected Fed rate cuts for 2026 and skyrocketing yields shattered Gold's $5,000 baseline, sending the metal plunging into the $4,100 to $4,300 territory.
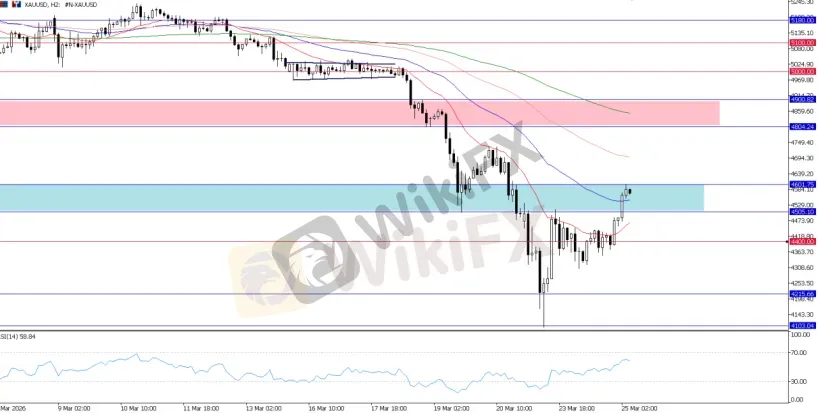
XAUUSD, H2 Chart
For now, Gold has temporarily found a bottom at the massive 4,100 to 4,200 zone, which serves as a historically defended demand block. For this bottom to be officially confirmed, Gold must successfully defend this zone and regain its footing above the 4,400 to 4,500 levels.
Currently, Gold is retesting the 4,500 mark; if it holds above this, further upside is likely. Meanwhile, 4,400 acts as the major last line of defense to keep the intraday bullish bias intact.
Bitcoin (BTCUSD): Compressing for a Breakout
While traditional safe havens and risk assets have swung wildly on macro headlines, Bitcoin is displaying incredible relative strength. The premier cryptocurrency is completely ignoring the broader macro panic and is currently compressing in a tight, highly explosive technical formation.
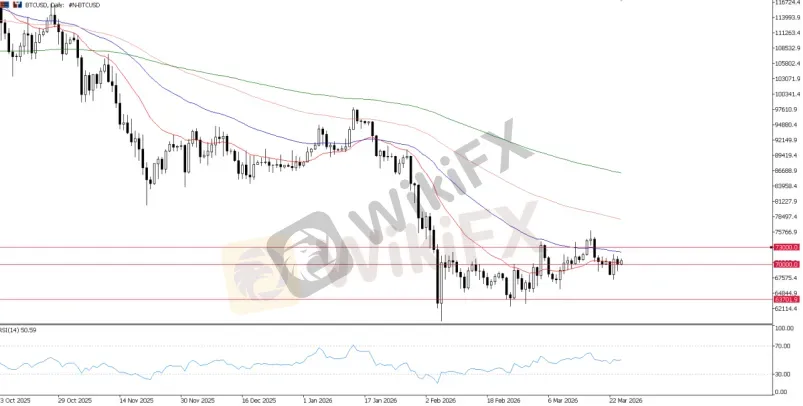
BTCUSD, Daily Chart
Bitcoin is currently consolidating tightly between the $70,000 support base and the $72,000 immediate resistance barrier. Buyers are aggressively defending the downside, forming higher lows that resemble a short-term uptrend.
If we see prices hold above $70,000 and a strong breakout above $73,000, it could open the door for a rapid surge toward the next high, or at least another leg up for short-term traders.
Bottom Line & What to Watch Today
Global markets are aggressively pricing in a tactical shift from risk-off to risk-on as geopolitical tensions temporarily cool, and with no doubt, the progress or the headline of the ceasefire talk will likely continue to dominate todays market outlook.

Disclaimer:
Le opinioni di questo articolo rappresentano solo le opinioni personali dell’autore e non costituiscono consulenza in materia di investimenti per questa piattaforma. La piattaforma non garantisce l’accuratezza, la completezza e la tempestività delle informazioni relative all’articolo, né è responsabile delle perdite causate dall’uso o dall’affidamento delle informazioni relative all’articolo.
WikiFX Trader
vantage
Sotto supervisione
FXCM
Sotto supervisione
JustMarkets
Sotto supervisione
D prime
Supervisione del paese
TMGM
Sotto supervisione
GTCFX
Sotto supervisione
vantage
Sotto supervisione
FXCM
Sotto supervisione
JustMarkets
Sotto supervisione
D prime
Supervisione del paese
TMGM
Sotto supervisione
GTCFX
Sotto supervisione
Rate Calc
USD

CNY
Tasso di cambio attuale:0
inserisci l'importo
USD
A disposizione
CNY
Calcolare 