
Broker Globale Piattaforma di Verifica Regolamentare
WikiFX
Italiano
简体中文
繁體中文
English
Pусский
日本語
ภาษาไทย
Tiếng Việt
Bahasa Indonesia
Español
हिन्दी
Filippiiniläinen
Français
Deutsch
Português
Türkçe
한국어
العربية
اردو
FPG USTEC Market Report March 25, 2026
Sommario:On the H1 timeframe chart, USTEC recorded two consecutive bearish rallies last week, declining sharply from 24,981 to 23,561, reflecting strong selling pressure during that period. At the beginning of
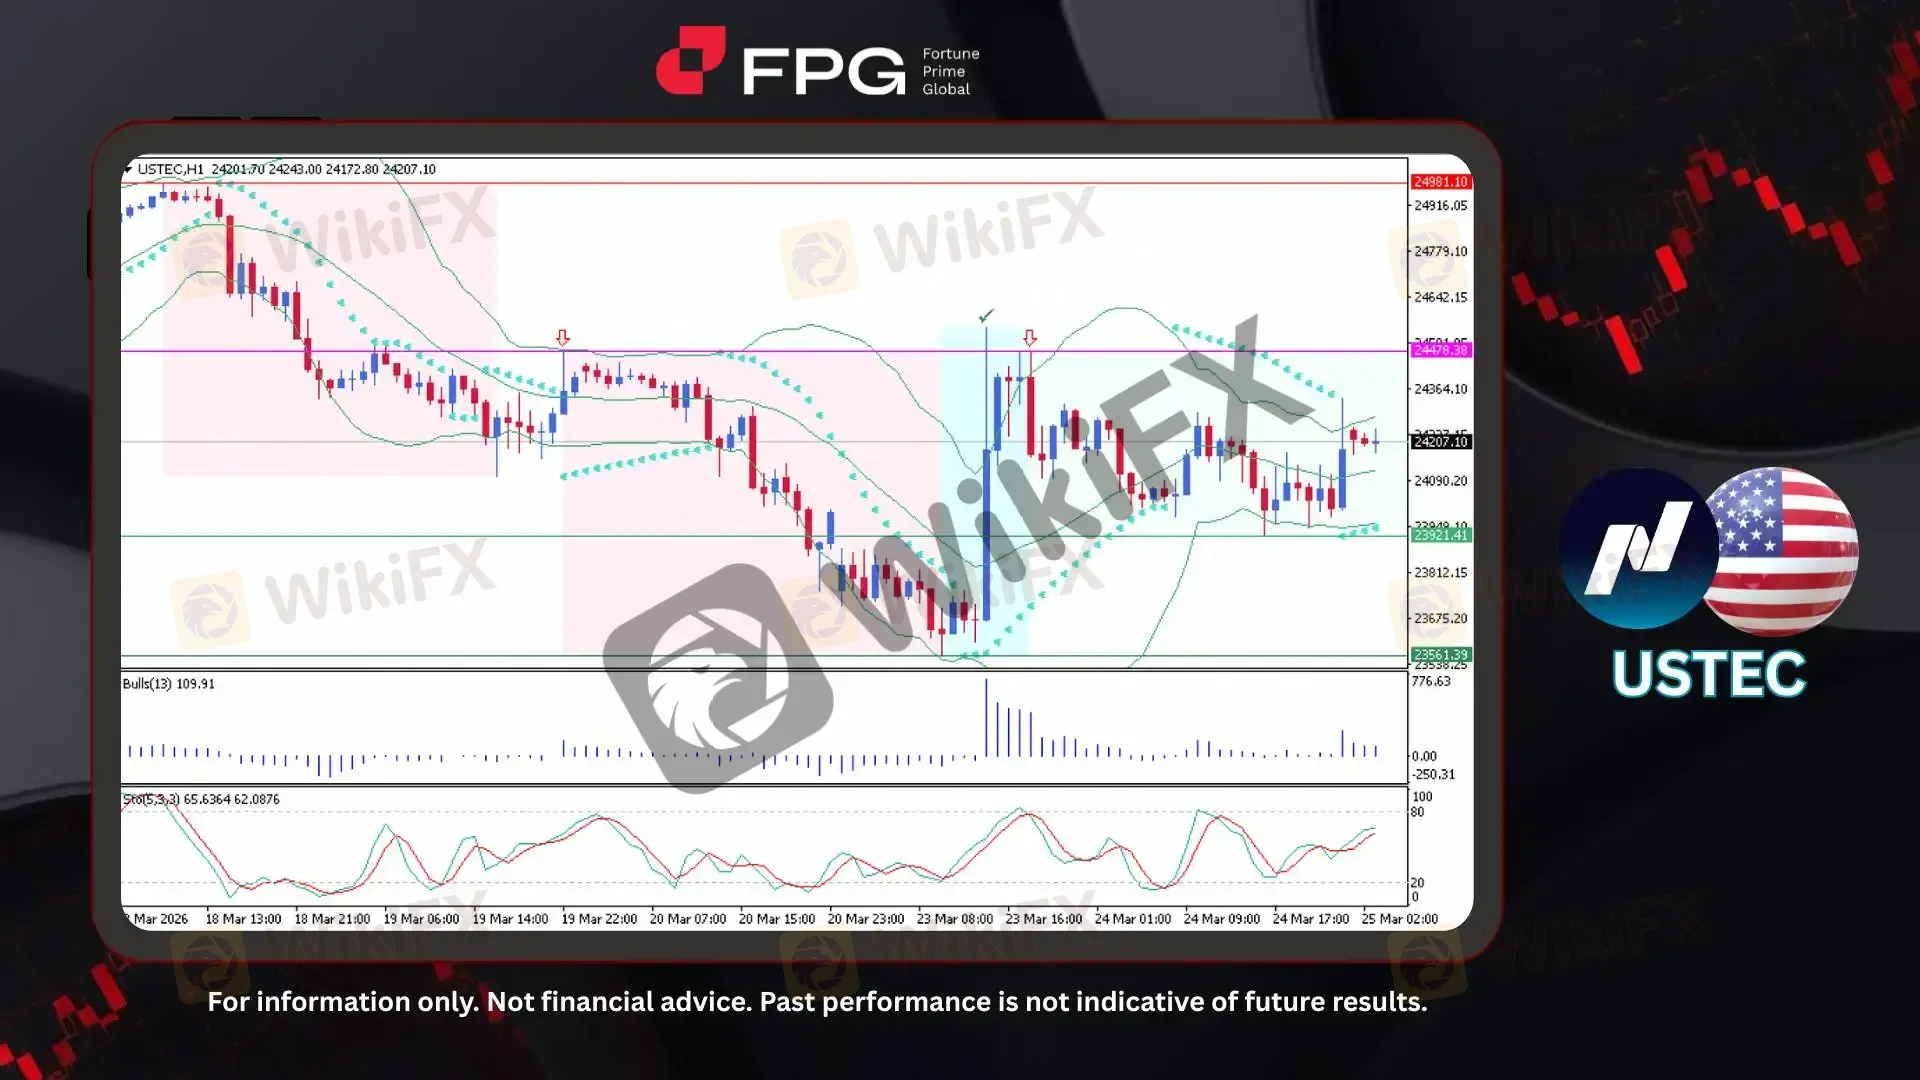
On the H1 timeframe chart, USTEC recorded two consecutive bearish rallies last week, declining sharply from 24,981 to 23,561, reflecting strong selling pressure during that period. At the beginning of this week, price rebounded from the 23,561 level, forming a bullish reversal rally that pushed upward toward the resistance area around 24,478. However, the upward move was rejected near that level, leading to a consolidation phase. Currently, USTEC is trading around 24,207, moving relatively stable within a sideways range between 23,921 and 24,478, indicating a temporary balance between buyers and sellers.
From a technical perspective, Bollinger Bands have started to narrow after previously expanding during the sharp bearish move, signaling a reduction in volatility as the market transitions into consolidation. Price is currently fluctuating near the mid-band, reflecting neutral short-term momentum. The Bulls Power (13) remains positive but has begun to moderate following the earlier bullish spike, suggesting that buying pressure is still present but no longer as strong as during the initial rebound. Meanwhile, the Stochastic Oscillator (5,3,3) is positioned in the upper range around 65–62, indicating moderately bullish momentum, though not yet in overbought territory, leaving room for potential continuation or further consolidation.
Recent U.S. economic data continues to reflect persistent inflationary pressures driven by rising oil prices, higher bond yields, and ongoing geopolitical tensions, prompting the Federal Reserve to remain cautious with limited expectations for near-term rate cuts. On the corporate side, performance remains mixed, with weakness in some sectors offset by resilience in AI, banking, and travel-related stocks. Meanwhile, major indices such as the S&P 500 and Dow Jones Industrial Average are experiencing increased volatility and downside pressure as markets adjust to a prolonged higher interest rate environment. Overall sentiment is becoming more defensive, although short-term rebounds remain possible, making it essential for traders to stay alert ahead of key U.S. economic releases that may influence market direction.
Technical Market Overview
1. Current Position: USTEC is trading around 24,207, consolidating within a sideways range following the recent bullish rebound from 23,561.
2. Resistance Zone: The nearest resistance is located at 24,478, which represents the recent rejection zone after the bullish recovery.
3. Support Zone: Immediate support stands near 23,921, aligning with the lower boundary of the current consolidation range.
4. Indicator Observation: Bollinger Bands show decreasing volatility as price stabilizes near the mid-band. Bulls Power (13) remains positive but is gradually weakening, indicating moderating buying pressure, while the Stochastic Oscillator (5,3,3) is holding in the upper range around 65–62, reflecting moderately bullish momentum without entering overbought territory.
5. Technical Summary: USTEC is currently in a consolidation phase after a strong bearish decline followed by a corrective bullish rebound. Momentum remains moderately positive, but price continues to move within a defined range, suggesting a wait-and-see market condition before the next directional breakout.
Market Performance:
Indices Last Price % Change
US500 6,609 +0.22%
US30 46.497 +0,23%
Today's Key Economic Calendar:
US: API Crude Oil Stock Change
US: Fed Barr Speech
JP: BoJ Monetary Policy Meeting Minutes
AU: Inflation Rate MoM & YoY
AU: RBA Trimmed Mean CPI MoM & YoY
AU: RBA Jones Speech
UK: Core Inflation Rate YoY
UK: Inflation Rate MoM & YoY
EU: ECB President Lagarde Speech
DE: Ifo Business Climate
US: MBA 30-Year Mortgage Rate
US: Current Account
US: Export & Import Prices MoM
US: EIA Crude Oil & Gasoline Stocks Change
Risk Disclaimer: This report is for informational purposes only and does not constitute financial advice. Investments involve risks, and past performance does not guarantee future results. Consult your financial advisor for personalized investment strategies.
Disclaimer:
Le opinioni di questo articolo rappresentano solo le opinioni personali dell’autore e non costituiscono consulenza in materia di investimenti per questa piattaforma. La piattaforma non garantisce l’accuratezza, la completezza e la tempestività delle informazioni relative all’articolo, né è responsabile delle perdite causate dall’uso o dall’affidamento delle informazioni relative all’articolo.
WikiFX Trader
vantage
Sotto supervisione
D prime
Supervisione del paese
FXCM
Sotto supervisione
XM
Sotto supervisione
EBC FINANCIAL GROUP
Sotto supervisione
FxPro
Sotto supervisione
vantage
Sotto supervisione
D prime
Supervisione del paese
FXCM
Sotto supervisione
XM
Sotto supervisione
EBC FINANCIAL GROUP
Sotto supervisione
FxPro
Sotto supervisione
Rate Calc
USD

CNY
Tasso di cambio attuale:0
inserisci l'importo
USD
A disposizione
CNY
Calcolare 