
Broker Globale Piattaforma di Verifica Regolamentare
WikiFX
Italiano
简体中文
繁體中文
English
Pусский
日本語
ภาษาไทย
Tiếng Việt
Bahasa Indonesia
Español
हिन्दी
Filippiiniläinen
Français
Deutsch
Português
Türkçe
한국어
العربية
اردو
DBG Markets: Market Report for Mar 24, 2026
Sommario:Oil Pullback Surging Yields Dominates Headlines;Oil, Dollar, Gold Yen OutlookThe global financial markets are navigating a highly complex and volatile landscape this week. A temporary pause in Middl

Oil Pullback & Surging Yields Dominates Headlines;Oil, Dollar, Gold & Yen Outlook
The global financial markets are navigating a highly complex and volatile landscape this week. A temporary pause in Middle East geopolitical escalations has triggered a sudden repricing across asset classes, but the underlying macroeconomic threats—sticky inflation, surging US Treasury yields, and a dominant US Dollar—remain firmly in the driver's seat.
US-Iran Conflict: The 5-Day Pause and Oil Market Volatility
The energy markets experienced a sudden, sharp pullback following reports that the US has postponed strikes on Iranian power plants and energy infrastructure for a five-day period.
While this temporary de-escalation triggered a rapid sell-off in crude oil, the broader fundamental reality remains highly toxic. The Strait of Hormuz remains effectively closed to Western shipping, creating a massive supply chain bottleneck.
Meanwhile, Trump's claims of “good talks” with Iran were firmly denied by Iranian officials, who dismissed the reports as fake news.
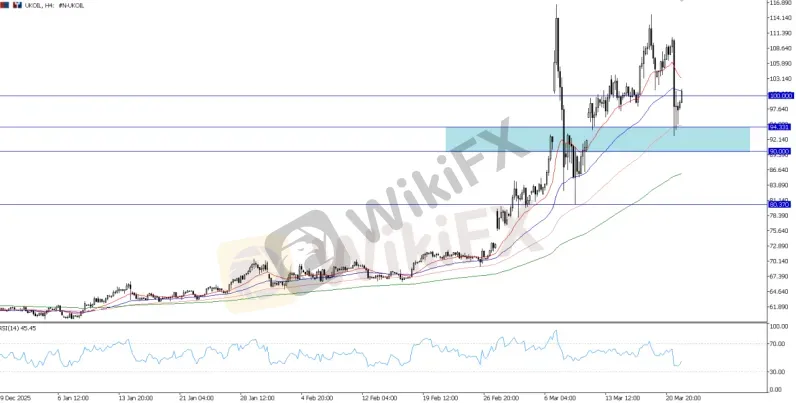
UKOIL, H4 Chart
Technically, UKOIL remains a “buy the dip” market as the broader bullish structure remains intact. The 90.00 to 94.00 zone continues to act as a strong structural support foundation for the commodity.
Meanwhile, the 100.00 mark serves as a key psychological level for bulls to defend. As long as prices remain elevated above this threshold, the “buy the dip” strategy holds strong.
Unless there is a definitive, formalized peace agreement that completely removes the supply threat, expect the market to maintain a heavy upward bias.
Gold Faces Pressure: Yield Surge Triggers Breakdown
While the initial outbreak of the US-Iran conflict triggered massive safe-haven support for the precious metal, surging yields continue to weigh heavily on Gold, especially following its recent parabolic run.
The explosive surge in oil prices guarantees that global inflation will remain sticky. Consequently, the market has completely priced out Federal Reserve rate cuts for 2026, causing US Treasury yields to aggressively spike.
This surging risk-free rate is acting as a massive gravitational weight on Gold. The metal has suffered a brutal technical breakdown from its recent highs and is currently struggling to maintain structural support.
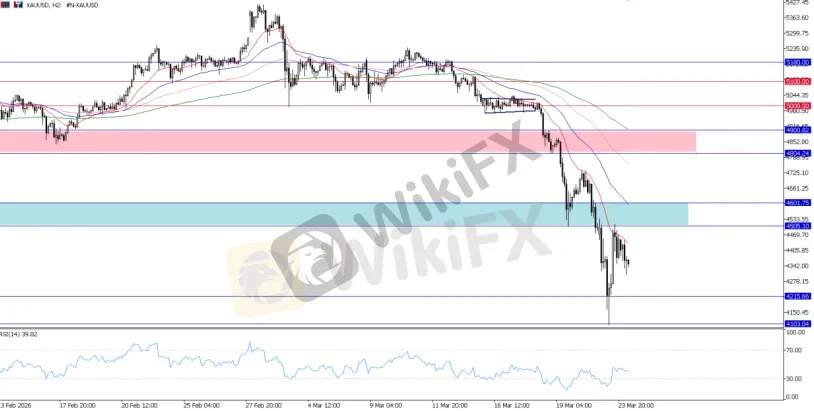
XAUUSD, H2 Chart
With Gold breaking below the 4,500 support zone, the near-term trend is now decisively bearish. Technically, sustained pressure below 4,500 makes further downside highly likely, with 4,100 standing as the next major support. Any rallies that fail to break above 4,500 should be treated as selling opportunities.
Unless Gold can significantly regain ground above the 4,500 ceiling, the near-term outlook remains heavily skewed to the downside.
US Dollar: The 100.00 Resistance Battleground
The US Dollar is the undisputed beneficiary of the current macroeconomic environment. However, the 100.00 mark remains a major psychological and structural resistance, which has recently led to a corrective move in the Greenback.
The 100.00 level remains a key battleground. We need to see a strong, high-volume daily close above 100.00 to confirm that the bulls have successfully conquered this resistance ceiling.
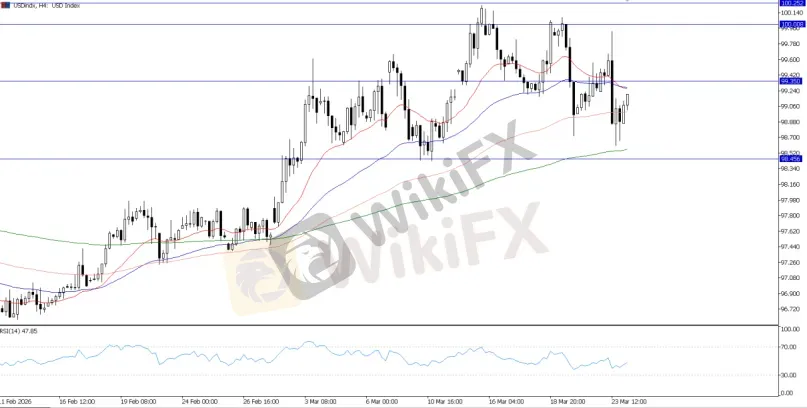
USD Index, H4 Chart
For now, the Dollar is likely to remain in consolidation within the 98.50 to 100.00 zone. The 99.35 level will act as the critical pivot line to determine the near-term trend.
Continued pressure below 99.35 would see the Dollar struggle, while a decisive break below 98.50 would signal a bearish reversal.
Conversely, holding above the 99.35 pivot ensures the bulls remain dominant, setting a strong technical stage for an eventual bullish breakout.
USDJPY: The 160.00 Intervention Powder Keg
With the Bank of Japan (BoJ) recently opting to hold its benchmark rate steady at 0.75% without offering a firm timeline for future hikes, the Japanese Yen has been left completely defenseless against the surging US Dollar.
However, the looming threat of intervention has pushed USDJPY slightly below the 159.00 to 160.00 red zone. Historically, the 160.00 handle is the absolute “line in the sand” for massive, multi-billion-dollar currency intervention by Japan's Ministry of Finance. Traders are currently playing a high-stakes game of chicken with the BoJ and MoF.
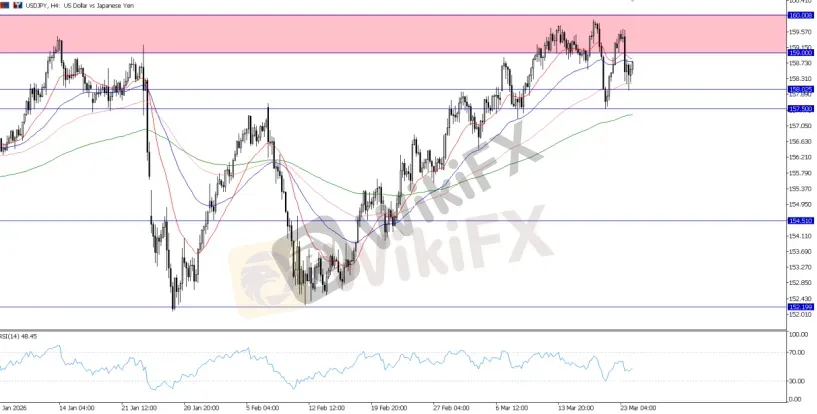
USDJPY, H4 Chart
USDJPY continues to face heavy overhead pressure near its 159.00 to 160.00 ceiling, signaling that intervention fears are effectively capping the upside. Technically, a decisive break below the 158.00 support level would trigger a bearish reversal in USDJPY, leading to a near-term downside move or a deeper corrective wave.
Bottom Line & What to Watch Today
The global markets remain highly sensitive to a toxic mix of geopolitical headlines and surging risk-free rates.

Disclaimer:
Le opinioni di questo articolo rappresentano solo le opinioni personali dell’autore e non costituiscono consulenza in materia di investimenti per questa piattaforma. La piattaforma non garantisce l’accuratezza, la completezza e la tempestività delle informazioni relative all’articolo, né è responsabile delle perdite causate dall’uso o dall’affidamento delle informazioni relative all’articolo.
WikiFX Trader
FOREX.com
Supervisione del paese
JustMarkets
Sotto supervisione
EBC FINANCIAL GROUP
Sotto supervisione
VT Markets
Sotto supervisione
D prime
Supervisione del paese
XM
Sotto supervisione
FOREX.com
Supervisione del paese
JustMarkets
Sotto supervisione
EBC FINANCIAL GROUP
Sotto supervisione
VT Markets
Sotto supervisione
D prime
Supervisione del paese
XM
Sotto supervisione
Rate Calc
USD

CNY
Tasso di cambio attuale:0
inserisci l'importo
USD
A disposizione
CNY
Calcolare 