
Broker Globale Piattaforma di Verifica Regolamentare
WikiFX
Italiano
简体中文
繁體中文
English
Pусский
日本語
ภาษาไทย
Tiếng Việt
Bahasa Indonesia
Español
हिन्दी
Filippiiniläinen
Français
Deutsch
Português
Türkçe
한국어
العربية
اردو
DBG Markets: Market Report for Mar 19, 2026
Sommario:Fed Higher for Longer Rocks Markets; BoJ in Focus NextUS Dollar, Japanese Yen, SP 500 Gold OutlookThe wait is over, and the Federal Reserve delivered exactly the bitter pill the markets were fearing.

Fed "Higher for Longer" Rocks Markets; BoJ in Focus NextUS Dollar, Japanese Yen, S&P 500 & Gold Outlook
The wait is over, and the Federal Reserve delivered exactly the bitter pill the markets were fearing. Global markets entered an aggressive risk-off phase following the FOMC decision. With the US Dollar surging and the equities market taking a heavy hit, the focus now shifts to the Bank of Japan (BoJ), where anticipated policy changes could further shape market momentum.
FOMC Recap: The Dot Plot Dictates Reality
In a highly anticipated move, the FOMC voted 11-1 to hold the benchmark interest rate steady at 3.50% to 3.75%. However, the absolute main event was the release of the updated Summary of Economic Projections (SEP), the "Dot Plot," and Chair Jerome Powell's press conference.
Driven by the explosive surge in oil prices from the ongoing US-Iran conflict, the Fed was forced to raise its inflation forecasts and drastically slash its rate-cut projections for 2026:

Fed Dot Plot March 2026 | Source: Federal Reserve
· Core PCE Inflation Forecast: Raised to 2.7% (up from the prior 2.4%).
· Median Dot Plot Projection: Slashed to a single rate cut—or potentially zero cuts—for the entirety of 2026.
Powell cited heavy "uncertainty" and confirmed that the Fed is in no rush to ease policy. The "higher for longer" narrative is no longer just a warning; it is the absolute, undisputed market reality.
US Dollar Outlook
The US Dollar has caught a massive fundamental tailwind following the recent FOMC meeting. The Dollar Index surged back toward the 100.00 mark after yesterday's brief pullback.
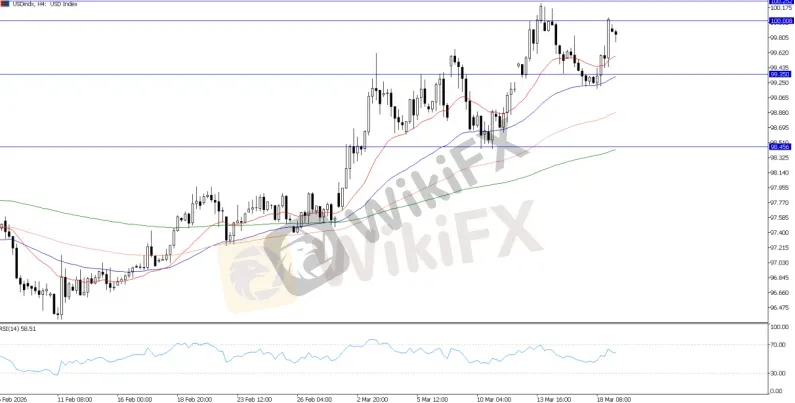
USD Index, H4
It is currently compressing tightly around the 100.00 psychological level, which acts as the ultimate liquidity ceiling. The index has successfully climbed to this high riding a strong short-term uptrend.
However, 100.00 remains a major structural resistance. If near-term post-FOMC momentum cannot force a clear breakout, the Dollar could face persistent resistance, requiring bulls to take more time to clear it.
In the near term, as long as the Dollar holds above the 99.35 support floor, it maintains a firmly bullish outlook.
S&P500 Outlook
The US500 is facing the exact opposite fundamental reality. The path of least resistance for global risk assets remains heavily skewed to the downside. Equities are staring down the barrel of a brutal "dual risk" environment:
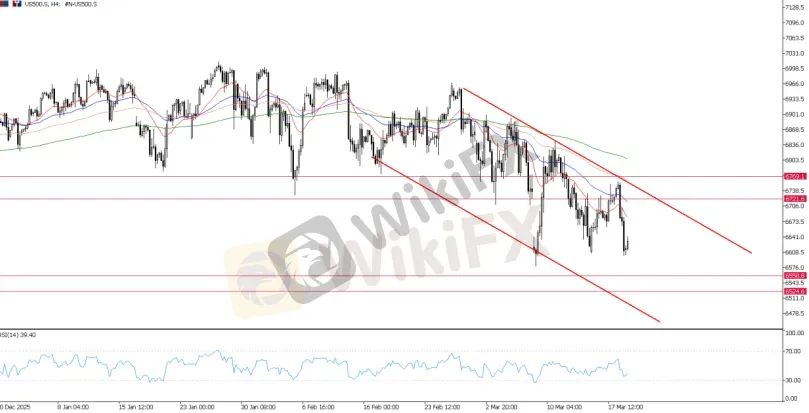
US500, H4 Chart
The index is currently trading under heavy pressure near the 6,700 zone, as covered earlier. It recently broke down through the floor of its medium-term channel, signaling a continued bearish structure.
The index now faces further downside risk toward the 6,520 to 6,500 area—a low last seen in November 2025. A continued risk-off environment could open the door for an even deeper structural correction.
BoJ Preview Today: The USDJPY Intervention Powder Keg
With the Fed out of the way, the global spotlight now shifts directly to Japan. The Bank of Japan concludes its critical policy meeting today. The BoJ is widely expected to hold its benchmark rate at 0.75%; however, markets expect a more hawkish signal regarding an imminent hike.
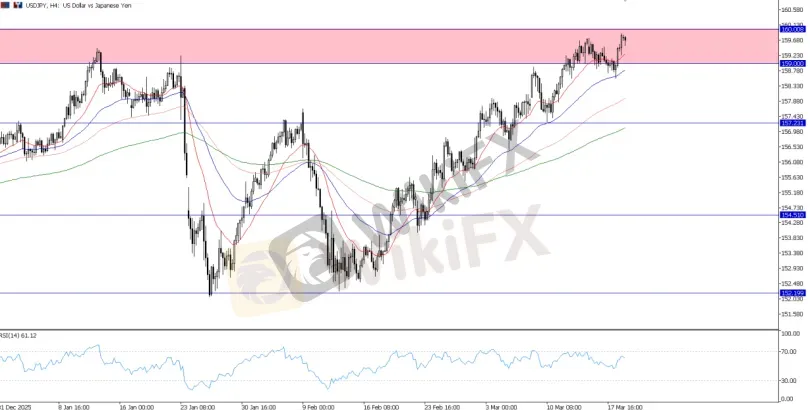
USDJPY, H4 Chart
The Fed's hawkish hold has pushed USDJPY directly into the 159.00 to 160.00 red zone. Historically, this is the absolute trigger point for massive currency intervention. The market is now waiting to see if the BoJ will signal any policy moves to support the Yen.
Technically, 159.00 is now the major support level; a decisive break below this could spark a short-term corrective move toward the 157.00 area.
What's Next for Gold? Support Shattered
Gold bulls suffered a massive technical and fundamental blow following the FOMC decision. While the metal initially drew safe-haven support from the Middle East conflict, the explosive surge in US Treasury yields and the dominant US Dollar proved too heavy a burden for the non-yielding asset.
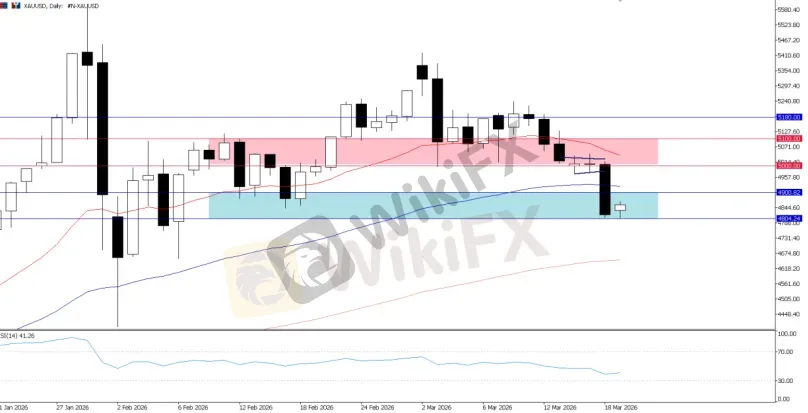
XAUUSD, Daily Chart
The critical 5,000 psychological baseline support was decisively shattered. Driven by the Fed's "higher for longer" confirmation, Gold slipped below the 4,900 mark. Gold must successfully reclaim the 4,900 zone to stabilize.
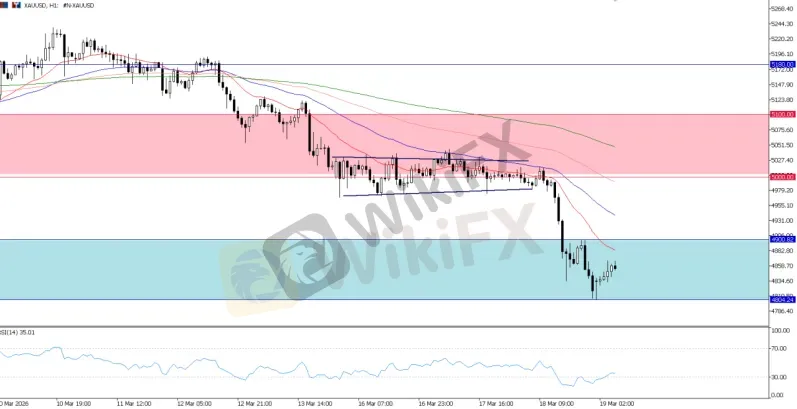
XAUUSD, H1 Chart
In the near-term and intraday timeframes, 4,900 remains the major resistance ceiling. Any bounce toward this level presents a "sell the rally" opportunity at this point, while 4,800 is currently holding as major support. Unless we see a definitive reclaim above 4,900, Gold remains an intraday short.
Bottom Line & What to Watch Today
The financial markets have aggressively repriced to reflect a stagflationary, "higher for longer" reality. Volatility will remain elevated as the market digests the Fed's hawkish hold and shifts focus to Tokyo.

Disclaimer:
Le opinioni di questo articolo rappresentano solo le opinioni personali dell’autore e non costituiscono consulenza in materia di investimenti per questa piattaforma. La piattaforma non garantisce l’accuratezza, la completezza e la tempestività delle informazioni relative all’articolo, né è responsabile delle perdite causate dall’uso o dall’affidamento delle informazioni relative all’articolo.
WikiFX Trader
Rate Calc
USD

CNY
Tasso di cambio attuale:0
inserisci l'importo
USD
A disposizione
CNY
Calcolare 