
Applicazione di richiesta di informazioni sulla regolamentazione dei broker globali
WikiFX
English
简体中文
繁體中文
English
Pусский
日本語
ภาษาไทย
Tiếng Việt
Bahasa Indonesia
Español
हिन्दी
Filippiiniläinen
Français
Deutsch
Português
Türkçe
한국어
العربية
FPG USDCAD Market Report March 12, 2026
Sommario:On the H1 timeframe chart, USDCAD previously experienced a bearish rally, declining from 1.3715 to 1.3525. Following this drop, the price entered a consolidation phase. Subsequent movement has been mo
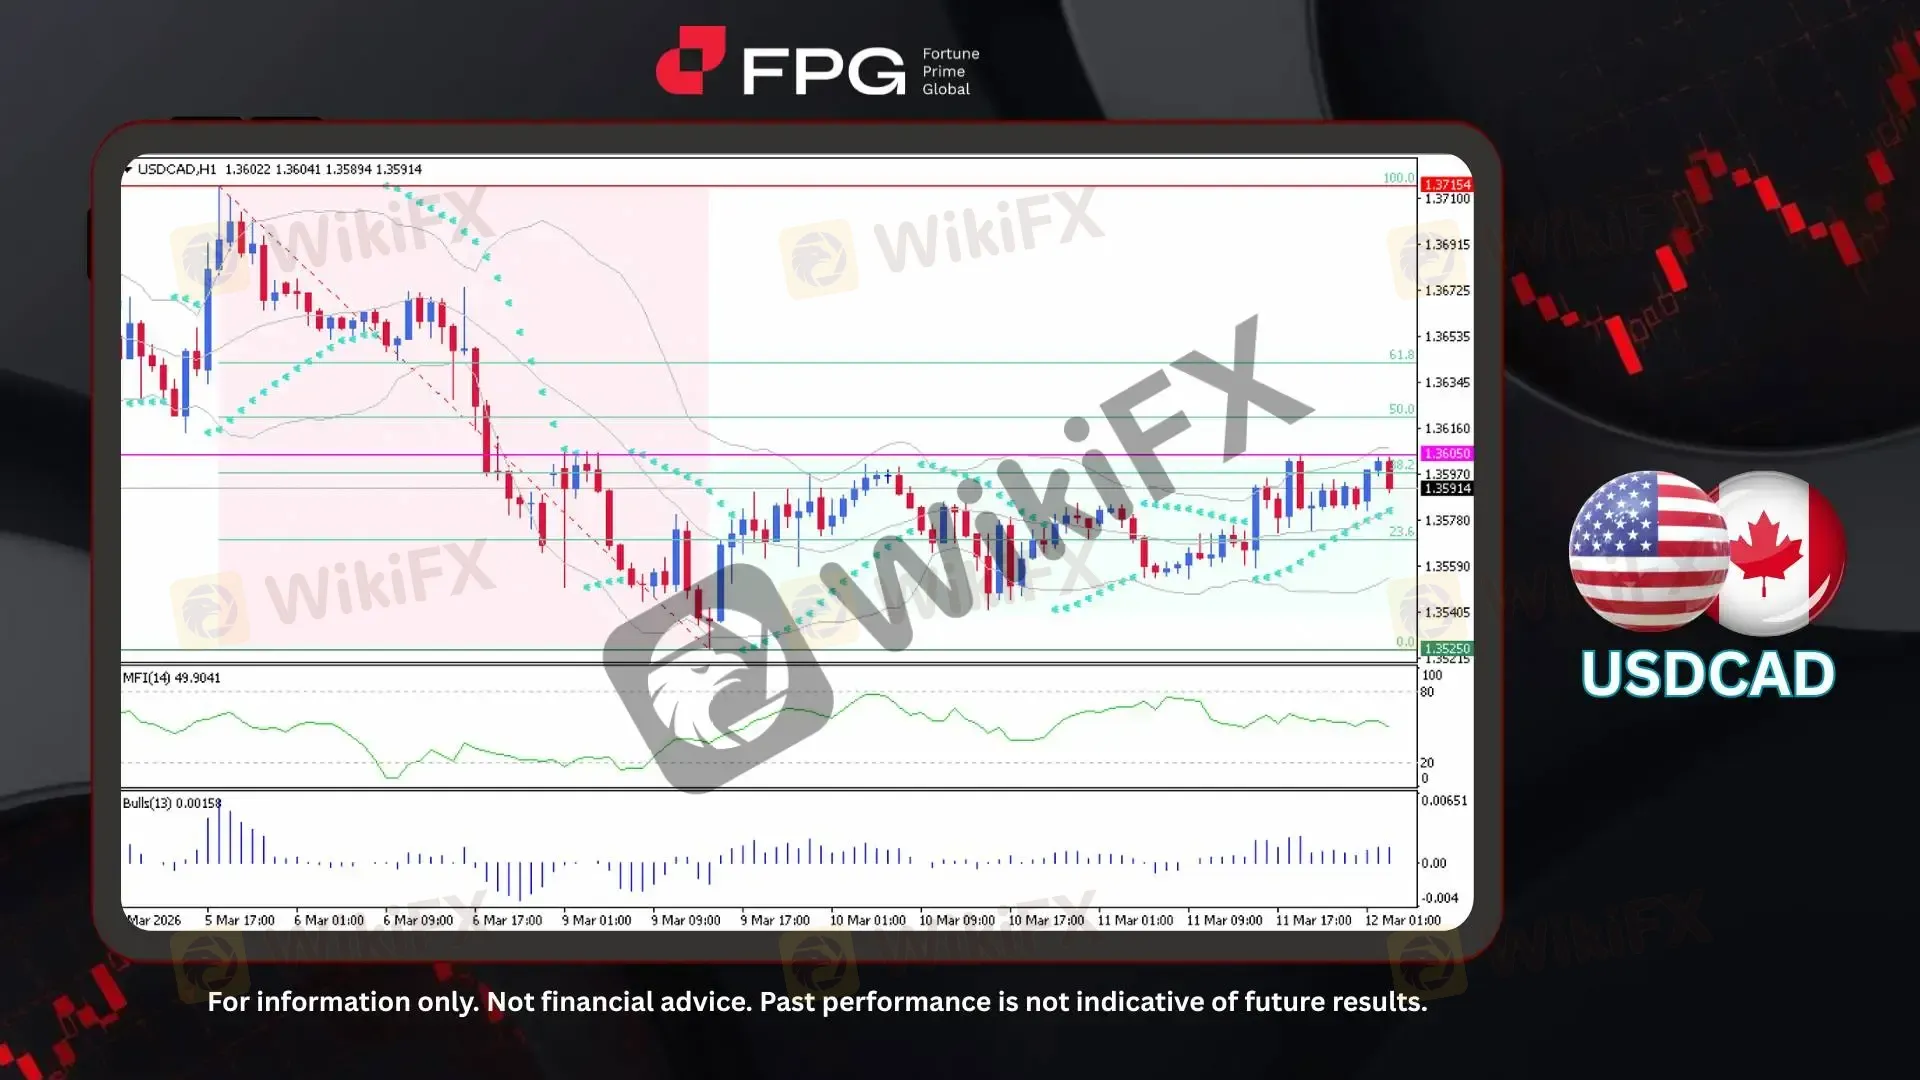
On the H1 timeframe chart, USDCAD previously experienced a bearish rally, declining from 1.3715 to 1.3525. Following this drop, the price entered a consolidation phase. Subsequent movement has been mostly sideways with a slight bullish bias, and the price has attempted to break above the 38.2% Fibonacci retracement level several times but was rejected near the 1.3605 resistance zone. The latest price is trading around 1.3591, with volatility gradually increasing as the pair approaches the upper boundary of the current consolidation range.
From a technical perspective, Fibonacci retracement drawn from the high at 1.3715 to the low at 1.3525 shows the 38.2% level near 1.3597–1.3605 acting as a resistance zone, while the 23.6% level serves as the nearest support area. The 50.0% and 61.8% retracement levels represent the next resistance zones if bullish momentum strengthens. Bollinger Bands are beginning to widen after a period of contraction, indicating gradually increasing volatility. Meanwhile, the Parabolic SAR has shifted below recent candles, signalling a bullish bias, and the Money Flow Index (MFI) is hovering around the neutral 50 level, suggesting balanced momentum as the market waits for a clearer directional breakout.
Over the past week, the Canadian dollar has been influenced by fluctuations in oil prices, shifting global risk sentiment, and expectations surrounding policy from the Bank of Canada. Rising geopolitical tensions initially lifted crude oil prices, supporting the commodity-linked CAD, but intermittent strength in the USD—driven by expectations around the U.S. Federal Reserve—limited further gains. Meanwhile, stable Canadian macro indicators kept markets cautious ahead of upcoming economic data. Technically, these mixed drivers correspond with consolidation in CAD pairs, as prices remain range-bound near key support and resistance levels while the market awaits a clearer catalyst.
Technical Market Overview
1. Current Position: USDCAD is trading around 1.3591, consolidating after its previous decline from 1.3715 to 1.3525, with price showing a slight bullish bias near the upper range.
2. Resistance Zone: The nearest resistance is around 1.3605, near the 38.2% Fibonacci retracement level.
3. Support Zone: Immediate support is located near the 23.6% Fibonacci level, while stronger support remains around 1.3525.
4. Indicator Observation: Bollinger Bands are gradually widening after a period of contraction, indicating rising short-term volatility. The Parabolic SAR has shifted below recent candles, suggesting mild bullish pressure, while the Money Flow Index (MFI) remains near the neutral 50 level, reflecting balanced market momentum.
5. Technical Summary: Overall, USDCAD remains in a consolidation phase with a slightly bullish bias as the price tests the upper boundary of the range. A decisive breakout above 1.3605 may strengthen bullish momentum, while failure to break this resistance could keep the pair moving sideways within the current range.
Market Performance:
Forex Last Price % Change
EUR/USD 1.1546 −0.18%
USD/JPY 159.10 +0.10%
Today's Key Economic Calendar:
US: Monthly Budget Statement
UK: RICS House Price Balance
UK: BoE Gov Bailey Speech
US: Balance of Trade
CA: Balance of Trade
US: Building Permits MoM & Preliminary
US: Exports & Imports
US: Goods Trade Balance Adv
US: Housing Starts & Housing Starts MoM
US: Initial Jobless Claims
US: Fed Bowman Speech
Risk Disclaimer: This report is for informational purposes only and does not constitute financial advice. Investments involve risks, and past performance does not guarantee future results. Consult your financial advisor for personalized investment strategies.
Disclaimer:
Le opinioni di questo articolo rappresentano solo le opinioni personali dell’autore e non costituiscono consulenza in materia di investimenti per questa piattaforma. La piattaforma non garantisce l’accuratezza, la completezza e la tempestività delle informazioni relative all’articolo, né è responsabile delle perdite causate dall’uso o dall’affidamento delle informazioni relative all’articolo.
WikiFX Trader
Vantage
Sotto supervisione
ZFX
Sotto supervisione
D prime
Supervisione del paese
IC Markets Global
Sotto supervisione
TMGM
Sotto supervisione
AVATRADE
Sotto supervisione
Vantage
Sotto supervisione
ZFX
Sotto supervisione
D prime
Supervisione del paese
IC Markets Global
Sotto supervisione
TMGM
Sotto supervisione
AVATRADE
Sotto supervisione
Rate Calc
USD

CNY
Tasso di cambio attuale:0
inserisci l'importo
USD
A disposizione
CNY
Calcolare 