
Broker Globale Piattaforma di Verifica Regolamentare
WikiFX
English
简体中文
繁體中文
English
Pусский
日本語
ภาษาไทย
Tiếng Việt
Bahasa Indonesia
Español
हिन्दी
Filippiiniläinen
Français
Deutsch
Português
Türkçe
한국어
العربية
FPG AUDUSD Market Report March 11, 2026
Sommario:On the H1 timeframe chart, AUDUSD is moving within a clearly defined bullish ascending channel that has developed over the recent sessions. The rally began from the 0.6955 low and advanced steadily to
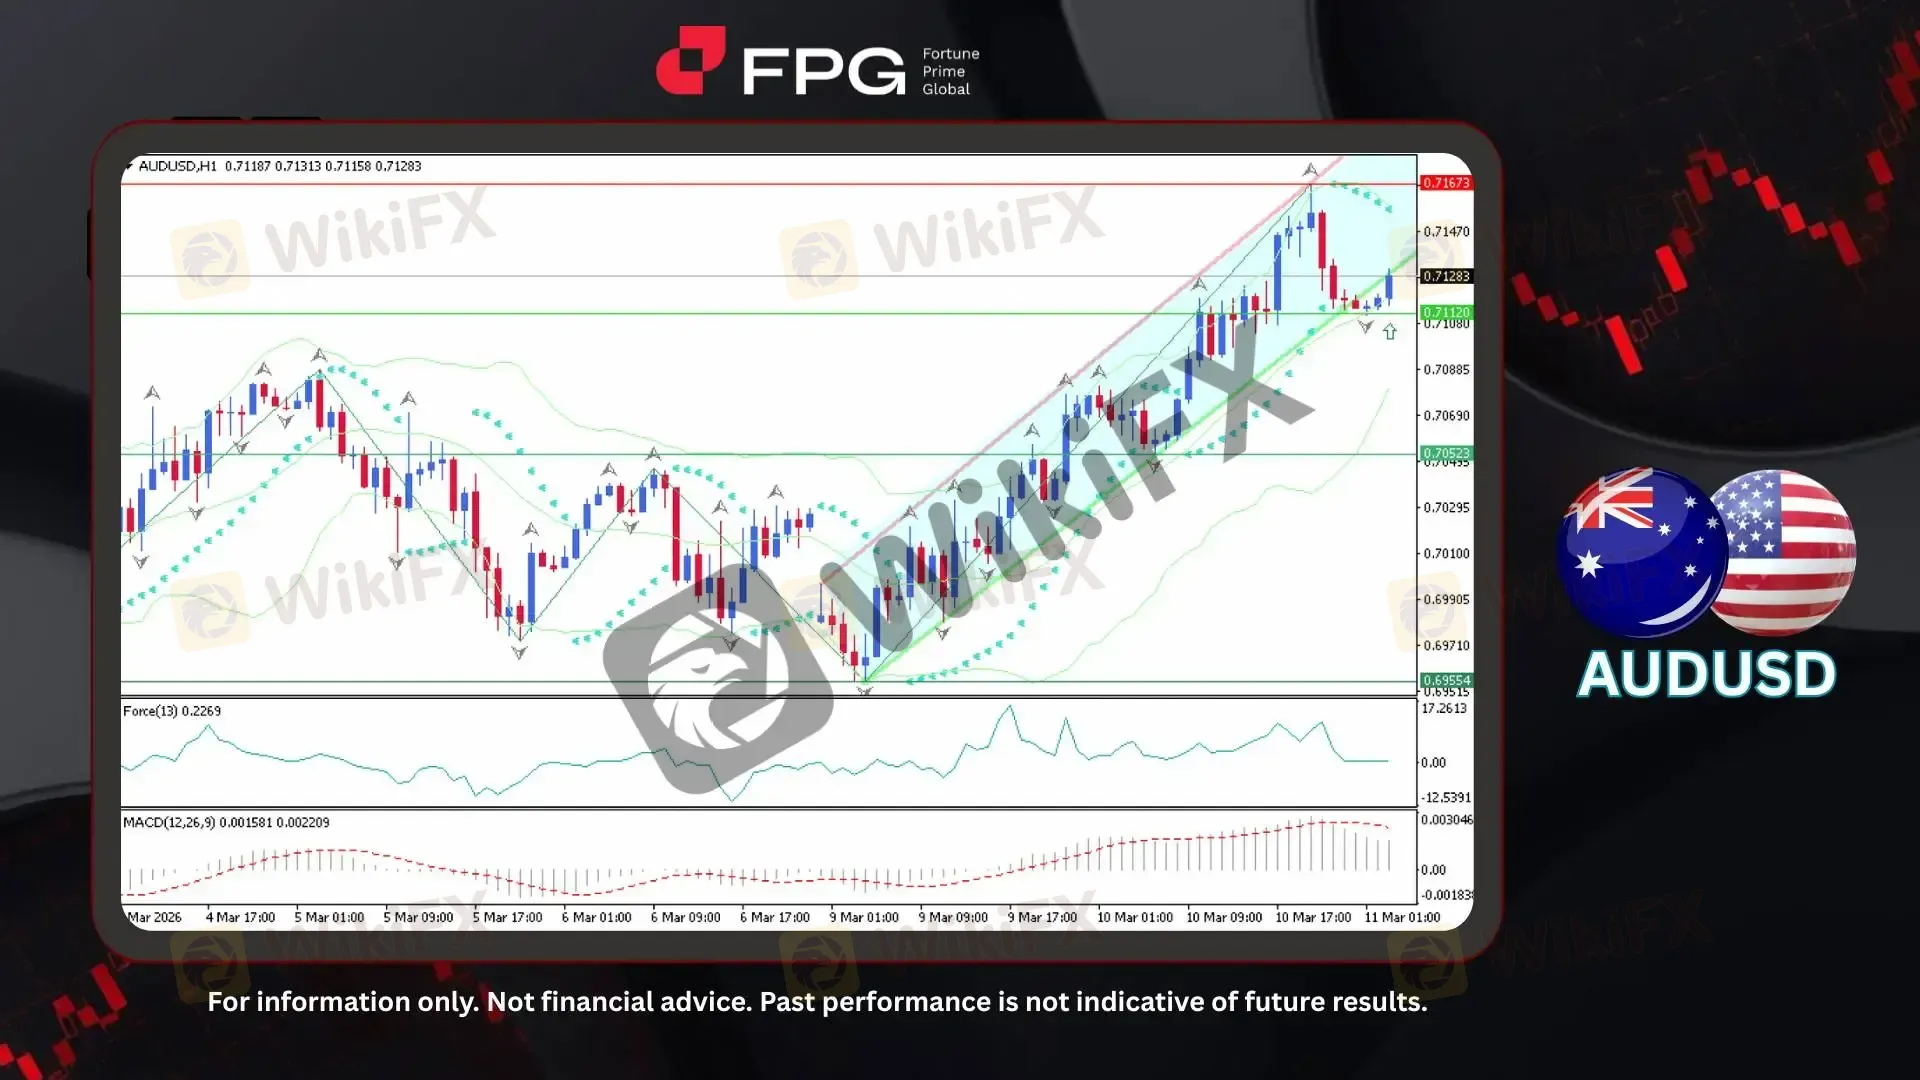
On the H1 timeframe chart, AUDUSD is moving within a clearly defined bullish ascending channel that has developed over the recent sessions. The rally began from the 0.6955 low and advanced steadily toward the 0.7167 peak before encountering resistance. Currently, the pair is trading around 0.7128, and the most recent candles show price slightly slipping below the lower boundary of the channel while attempting to re-enter the structure. This area represents a technically important juncture, as it will determine whether the pair stabilizes and resumes the upward channel movement or transitions into a deeper corrective phase.
From a technical perspective, the broader structure still reflects an upward trend despite the recent pullback. Bollinger Bands remain moderately expanded following the rally, indicating sustained volatility during the bullish move, while price is currently testing the mid-band region as short-term momentum softens. The Force Index (13) has declined toward neutral territory, suggesting that buying pressure has weakened after the recent peak. Meanwhile, the MACD (12,26,9) remains in positive territory with the histogram still above the zero line, although momentum appears to be gradually moderating, indicating a potential consolidation phase following the prior upward impulse.
AUDUSD continues to face pressure as resilient U.S. macroeconomic data reinforces expectations that the Federal Reserve may maintain higher interest rates for longer, strengthening the U.S. dollar through widening yield differentials. At the same time, markets remain attentive to whether the Reserve Bank of Australia will maintain a restrictive policy stance amid persistent inflation but moderating domestic economic growth. Elevated geopolitical tensions and broader global uncertainty have also increased safe-haven demand for the U.S. dollar, limiting the Australian dollars upside momentum. As a result, AUDUSD price dynamics remain heavily influenced by interest-rate differentials, geopolitical developments, and broader shifts in global risk sentiment.
Technical Market Overview
1. Current Position: AUDUSD is trading around 0.7128, fluctuating near the lower boundary of the ascending bullish channel following a short-term corrective pullback from the recent high.
2. Resistance Zone: The nearest resistance is located at 0.7167, representing the recent swing high where the latest rally encountered selling pressure.
3. Support Zone: Immediate support is positioned near 0.7112, which corresponds to the recent consolidation structure.
4. Indicator Observation: Bollinger Bands show sustained volatility following the prior rally, with price currently interacting around the mid-band as short-term momentum cools. The Force Index (13) has eased toward neutral territory, indicating weakening buying pressure, while the MACD (12,26,9) remains above the zero line with a positive histogram, suggesting that the broader bullish momentum has not fully reversed despite the ongoing pullback.
5. Technical Summary: AUDUSD remains closely tied to the broader ascending channel structure despite the recent temporary break below the lower boundary. Momentum indicators show moderating bullish pressure while the pair continues trading within the broader upward trend framework.
Market Performance:
Forex Last Price % Change
EUR/USD 1.1615 +0.06%
USD/JPY 158.27 +0.13%
Today's Key Economic Calendar:
US: API Crude Oil Stock Change
US: MBA 30-Year Mortgage Rate
US: Core Inflation Rate MoM & YoY
US: CPI & CPI s.a
US: Fed Bowman Speech
US: Inflation Rate MoM & YoY
US: EIA Crude Oil & Gasoline Stocks Change
Risk Disclaimer: This report is for informational purposes only and does not constitute financial advice. Investments involve risks, and past performance does not guarantee future results. Consult your financial advisor for personalized investment strategies.
Disclaimer:
Le opinioni di questo articolo rappresentano solo le opinioni personali dell’autore e non costituiscono consulenza in materia di investimenti per questa piattaforma. La piattaforma non garantisce l’accuratezza, la completezza e la tempestività delle informazioni relative all’articolo, né è responsabile delle perdite causate dall’uso o dall’affidamento delle informazioni relative all’articolo.
WikiFX Trader
HFM
Sotto supervisione
FXTM
Sotto supervisione
STARTRADER
Sotto supervisione
EBC FINANCIAL GROUP
Sotto supervisione
D prime
Supervisione del paese
XM
Sotto supervisione
HFM
Sotto supervisione
FXTM
Sotto supervisione
STARTRADER
Sotto supervisione
EBC FINANCIAL GROUP
Sotto supervisione
D prime
Supervisione del paese
XM
Sotto supervisione
Rate Calc
USD

CNY
Tasso di cambio attuale:0
inserisci l'importo
USD
A disposizione
CNY
Calcolare 