
Broker Globale Piattaforma di Verifica Regolamentare
WikiFX
English
简体中文
繁體中文
English
Pусский
日本語
ภาษาไทย
Tiếng Việt
Bahasa Indonesia
Español
हिन्दी
Filippiiniläinen
Français
Deutsch
Português
Türkçe
한국어
العربية
DBG Markets: Market Report for Mar 3, 2026
Sommario:US Equities Rebound as Global Indices Slip;US Indices, USDCHF Gold OutlookGlobal equity markets experienced a dramatic divergence on Monday following the weekends geopolitical shock. While major glob

US Equities Rebound as Global Indices Slip;US Indices, USDCHF & Gold Outlook
Global equity markets experienced a dramatic divergence on Monday following the weekend's geopolitical shock. While major global indices, including the Nikkei and Euro Stoxx 50, closed firmly in the red as investors digested the escalating Middle East conflict, US equities staged a massive intraday comeback.
The tech-heavy Nasdaq Composite and the S&P 500 managed to erase steep morning losses, fueled by aggressive dip-buying in cash-rich tech leaders. However, the question remains: Can US indices sustain this rebound?
US Indices Outlook: Do Risks Still Linger?
Despite their recent resilience, underlying technical and fundamental risks remain critically high. The massive surge in crude oil prices has reignited inflation fears, while the "higher-for-longer" narrative and geopolitical uncertainty continue to pose severe risks to the US market.
From a technical perspective, US indices remain highly vulnerable to pullback risks.
Nasdaq100 (UT100) Outlook
While the "buy the dip" mentality provided a temporary cushion, the index is still heavily pressured by the overarching macroeconomic environment of higher yields and war premiums.
Technically, recent selling pressure near the 26,000 mark has stalled the Nasdaq's record-high rally. As we covered earlier, the psychological 25,000 level remains the absolute line in the sand.
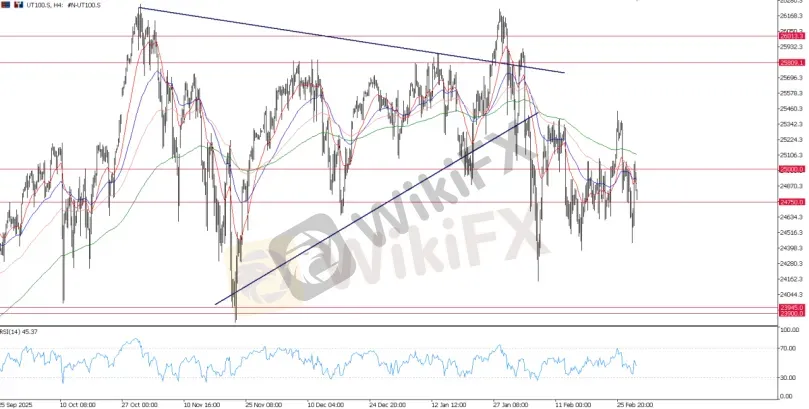
UT100, H4 Chart
The fact that recent rebounds have consistently faced pressure pushing back below the 25,000 handle suggests that bullish momentum is fading while bearish strength is building up. If the Nasdaq 100 fails to hold its ground above 25,000, a decisive break would confirm that bearish momentum dominates, posing the risk of a deeper technical correction toward the 24,200 – 24,000 support zone, or potentially even lower.
The upside remains firmly capped as long as the Middle East conflict continues to threaten global supply chains and investor confidence. Furthermore, tariff uncertainties remain unresolved, even though they have been temporarily overshadowed by this week's geopolitical risks.
US Dollar Breakout & SNB Intervention Warning
In the currency market, the US Dollar has firmly established itself as the ultimate safe-haven currency amidst the current geopolitical chaos.
The Dollar Index continues to pressure the formidable 98.00 resistance ceiling, driven by dual tailwinds: massive capital flight and expectations that the Federal Reserve will be forced to hold rates higher for longer due to energy-driven inflation.
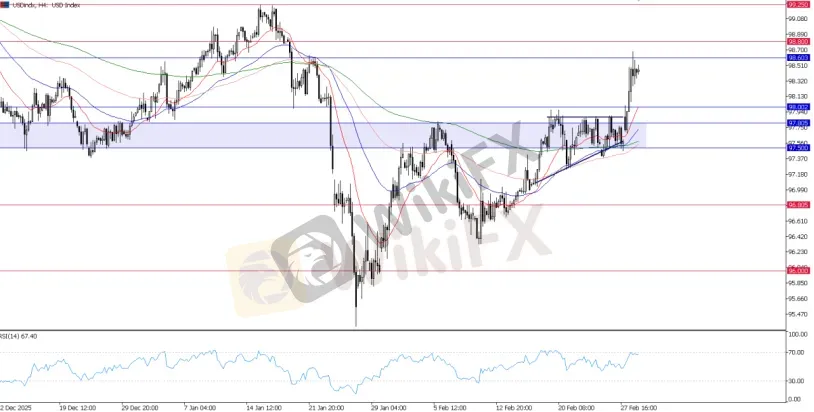
USD Index, H4 Chart
Breaking above 98.00 now gives the US Dollar the upper hand against major currencies. With this breakout, any minor dips in the Greenback are likely to be heavily bought by Dollar bulls.
USDCHF Outlook
This Dollar breakout brings the USDCHF pair into sharp focus. Traditionally, the Swiss Franc also acts as a primary safe-haven asset during times of war. However, the Swiss National Bank (SNB) has issued warnings regarding market intervention due to the recent flood of capital into the Franc driven by risk aversion.
If the SNB actively intervenes to weaken the Franc in the open market, it will provide an aggressive, artificial tailwind for the USDCHF pair. The sheer strength of the Dollar's fundamental drivers, combined with this intervention risk, could push USDCHF significantly higher.
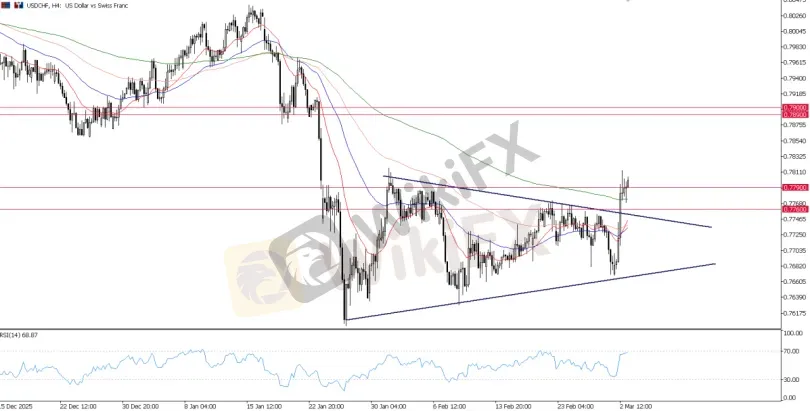
USDCHF, H4 Chart
Regarding the USDCHF outlook, the broader trend remains a bearish one, with the pair now trading near a 15-year low (a level last seen in 2011). This extreme over-appreciation of the Swiss Franc is likely putting the SNB on high alert.
Meanwhile, in the near term, if the market views this as oversold and intervention risks dominate sentiment, USDCHF poses a strong potential for a near-term bullish reversal.
Technically, USDCHF has broken out from its recent converging triangle near decade lows, staging a potential bullish breakout pattern. A gain above the 0.7760 – 0.7790 resistance zone would open the door for another leg higher toward the 0.7900 area.
Gold: Bullish Remain Intact
Gold prices exploded higher at the start of the week, fully absorbing the geopolitical panic. The precious metal gapped up aggressively, breaking past previous resistance levels and trading near $5,370 per ounce, solidifying its status as the market's primary shield against uncertainty.
From a technical perspective, Gold remains in a highly aggressive uptrend. The previous resistance zone of 5240 – 5300 has now completely flipped into a massive support base. As long as Gold maintains its footing above the 5300 level, the technical structure heavily favors the bulls.
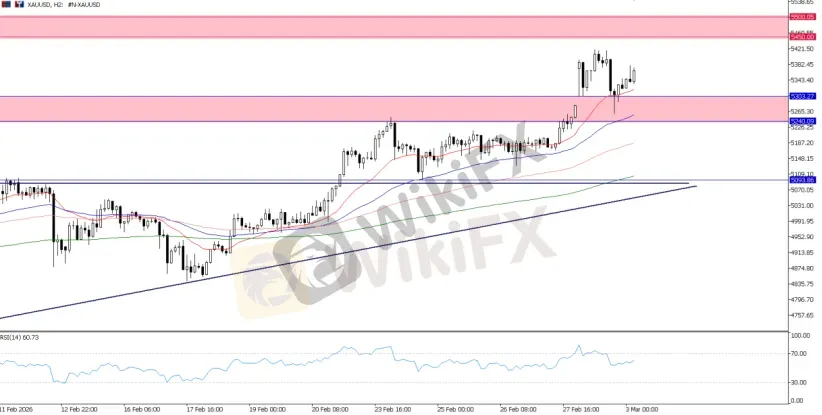
XAUUSD, H2 Chart
Still, yesterday's pullback indicates that the market is not blindly pricing in an infinite risk premium for Gold, especially given that it is currently trading near historical highs.
For the intraday outlook, the 5300 level serves as immediate support, while 5450 serves as the immediate upside target.

Disclaimer:
Le opinioni di questo articolo rappresentano solo le opinioni personali dell’autore e non costituiscono consulenza in materia di investimenti per questa piattaforma. La piattaforma non garantisce l’accuratezza, la completezza e la tempestività delle informazioni relative all’articolo, né è responsabile delle perdite causate dall’uso o dall’affidamento delle informazioni relative all’articolo.
WikiFX Trader
D prime
Supervisione del paese
STARTRADER
Sotto supervisione
TICKMILL
Sotto supervisione
OANDA
Supervisione del paese
TMGM
Sotto supervisione
FOREX.com
Supervisione del paese
D prime
Supervisione del paese
STARTRADER
Sotto supervisione
TICKMILL
Sotto supervisione
OANDA
Supervisione del paese
TMGM
Sotto supervisione
FOREX.com
Supervisione del paese
Rate Calc
USD

CNY
Tasso di cambio attuale:0
inserisci l'importo
USD
A disposizione
CNY
Calcolare 