
Broker Globale Piattaforma di Verifica Regolamentare
WikiFX
English
简体中文
繁體中文
English
Pусский
日本語
ภาษาไทย
Tiếng Việt
Bahasa Indonesia
Español
हिन्दी
Filippiiniläinen
Français
Deutsch
Português
Türkçe
한국어
العربية
FPG USDJPY Market Report February 27, 2026
Sommario:On the H4 timeframe chart, USDJPY shows that after a previous price drop from 157.65 to 152.26, the trend direction shifted into a bullish rally. Price has been moving upward consistently, forming a c
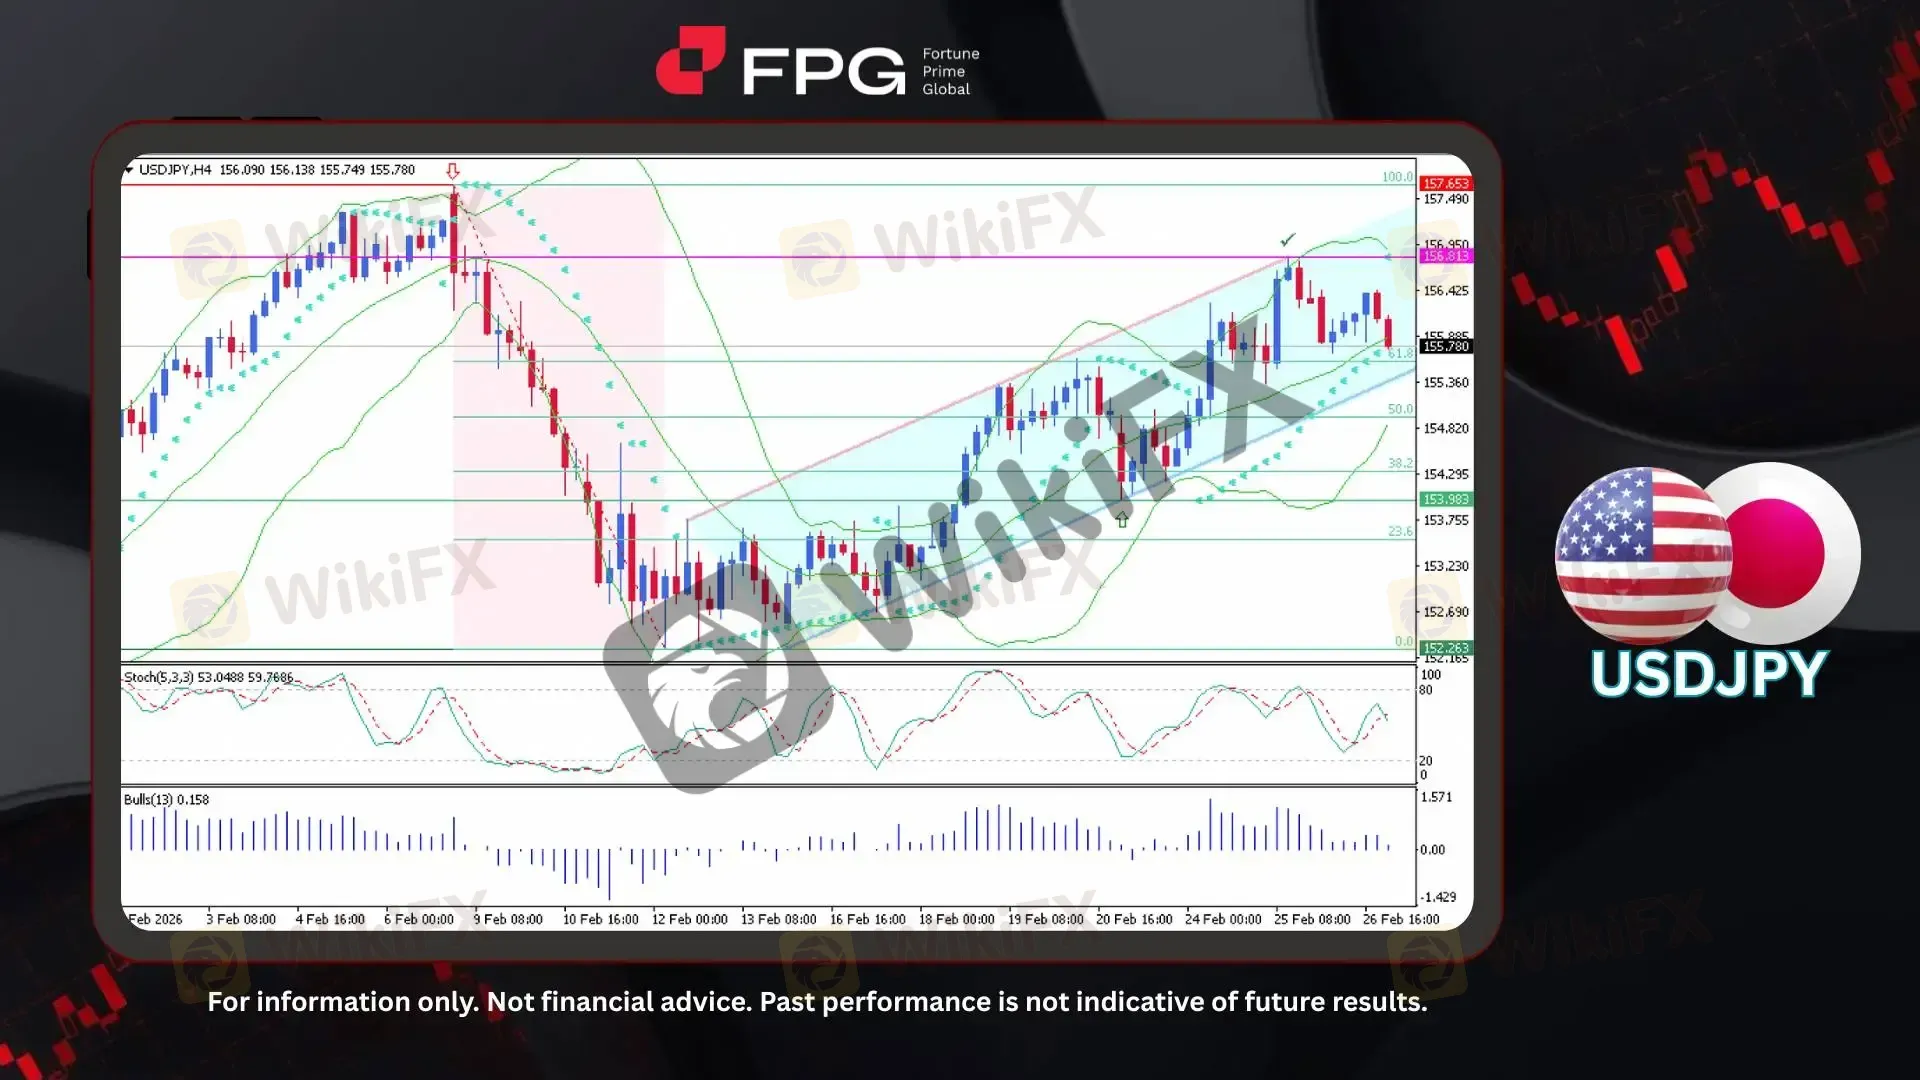
On the H4 timeframe chart, USDJPY shows that after a previous price drop from 157.65 to 152.26, the trend direction shifted into a bullish rally. Price has been moving upward consistently, forming a clearly defined bullish channel with higher highs and higher lows. Recently, the pair faced rejection near the diagonal resistance of the channel around 156.81, which stands as a crucial barrier for a potential breakout continuation. The current price is trading around 155.78, with volatility remaining relatively elevated as the market consolidates below resistance.
From a technical indicator perspective, Bollinger Bands (20) show price fluctuating in the upper half of the band, suggesting bullish bias remains intact, although recent candles indicate mild consolidation rather than strong expansion. The Parabolic SAR dots confirm that the short-term trend structure is still bullish as long as price holds above the ascending channel support. The Stochastic Oscillator (5,3,3) is hovering around the mid-level (near 50–60), reflecting neutral-to-moderate bullish momentum without entering overbought territory. Meanwhile, Bulls Power (13) remains slightly positive but shows signs of flattening, indicating that bullish momentum is still present but not as aggressive as in the previous impulse wave.
USDJPY remains supported by broad U.S. dollar strength, with the pair recently pushing toward the mid-to-upper 150s amid ongoing policy divergence between the United States and Japan. However, concerns over potential intervention and verbal warnings from Japanese officials have limited further upside, especially as the pair approaches key technical levels near 157. Meanwhile, a cautious and data-dependent stance from the Bank of Japan continues to shape expectations for yen volatility in the near term, keeping traders alert to sudden price swings around major resistance zones.
Market Observation & Strategy Advice
1. Current Position: USDJPY trades around 155.78, holding within a bullish channel after rebounding from 152.26. The structure remains bullish despite rejection near 156.81.
2. Resistance Zone: 156.81 is the key channel resistance, followed by 157.65. A confirmed H4 breakout above 156.81 may open room toward 157.65.
3. Support Zone: Immediate support lies at 155.36, with stronger support near 153.98. A break below 153.98 may weaken the bullish structure.
4. Indicator Observation: Bollinger Bands show price in the upper half, signaling sustained bullish bias with mild consolidation. Parabolic SAR confirms ongoing bullish momentum. Stochastic (5,3,3) sits near mid-level, indicating neutral-to-moderate momentum without overbought signals. Bulls Power remains slightly positive but flattening, suggesting easing buying pressure compared to the previous rally.
5. Trading Strategy Suggestions:
Bullish Scenario: Consider buy-on-dip opportunities near channel support (155.36) while price remains inside the bullish channel, targeting 156.81 and 157.65.
Breakout Strategy: A strong H4 close above 156.81 may confirm upside continuation toward 157.65 and beyond.
Bearish Scenario: A decisive break below 153.98 may invalidate the bullish channel structure and shift bias toward deeper correction levels. Maintain disciplined risk management, especially as the pair trades near intervention-sensitive levels.
Market Performance:
Forex Last Price % Change
EUR/USD 1.1799 +0.02%
GBP/USD 1.3488 +0.05%
Today's Key Economic Calendar:
JP: Industrial Production MoM Preliminary
JP: Retail Sales YoY
UK: GfK Consumer Confidence
JP: Housing Starts YoY
DE: Unemployed Persons
DE: Unemployment Change & Rate
CN: FDI (YTD) YoY
DE: Inflation Rate MoM & YoY Preliminary
US: Core PPI MoM
CA: GDP Growth Rate Annualized & QoQ
CA: GDP MoM
US: PPI MoM
US: Chicago PMI
Risk Disclaimer: This report is for informational purposes only and does not constitute financial advice. Investments involve risks, and past performance does not guarantee future results. Consult your financial advisor for personalized investment strategies.
Disclaimer:
Le opinioni di questo articolo rappresentano solo le opinioni personali dell’autore e non costituiscono consulenza in materia di investimenti per questa piattaforma. La piattaforma non garantisce l’accuratezza, la completezza e la tempestività delle informazioni relative all’articolo, né è responsabile delle perdite causate dall’uso o dall’affidamento delle informazioni relative all’articolo.
WikiFX Trader
XM
Sotto supervisione
EC markets
Sotto supervisione
AVATRADE
Sotto supervisione
GO Markets
Sotto supervisione
FXCM
Sotto supervisione
EBC FINANCIAL GROUP
Sotto supervisione
XM
Sotto supervisione
EC markets
Sotto supervisione
AVATRADE
Sotto supervisione
GO Markets
Sotto supervisione
FXCM
Sotto supervisione
EBC FINANCIAL GROUP
Sotto supervisione
Rate Calc
USD

CNY
Tasso di cambio attuale:0
inserisci l'importo
USD
A disposizione
CNY
Calcolare 