
Broker Globale Piattaforma di Verifica Regolamentare
WikiFX
English
简体中文
繁體中文
English
Pусский
日本語
ภาษาไทย
Tiếng Việt
Bahasa Indonesia
Español
हिन्दी
Filippiiniläinen
Français
Deutsch
Português
Türkçe
한국어
العربية
FPG XAUUSD Market Report February 16, 2026
Sommario:On the H1 timeframe chart, XAUUSD (Gold) previously moved within a relatively stable sideways range with a slight bullish bias, reflecting controlled upward pressure. However, the market then experien
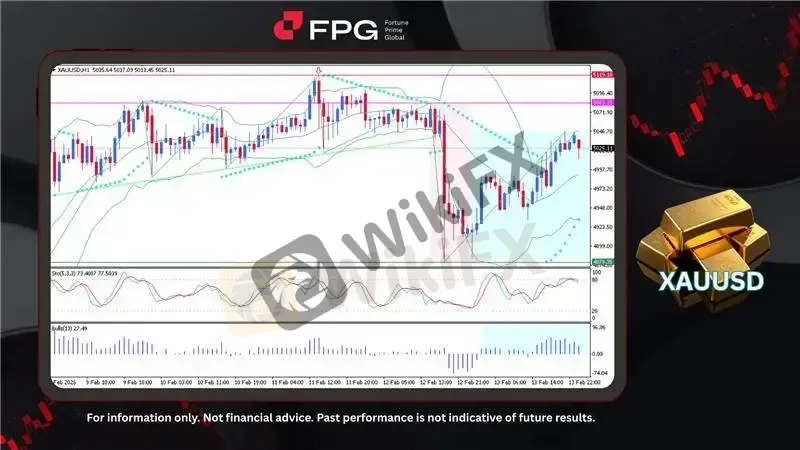
On the H1 timeframe chart, XAUUSD (Gold) previously moved within a relatively stable sideways range with a slight bullish bias, reflecting controlled upward pressure. However, the market then experienced a sharp and significant price drop from 5083 to 4878, indicating strong selling momentum and a temporary breakdown of the prior structure. From that low, a technical bounce emerged, followed by a fairly consistent and structured recovery phase supported by renewed buying interest. The current price is trading around 5025, as volatility moderates following the earlier spike, suggesting the market is stabilizing while maintaining a short-term recovery tone.
Technical indicators reflect a sustained recovery following the sharp decline. Price is trading above the Bollinger Bands mid-line and moving toward the upper band, while volatility has begun to stabilize after the prior expansion. The Parabolic SAR dots are positioned below the candles, confirming a short-term bullish bias, and price remains above the upward-sloping moving average, reinforcing the recovery structure. The Stochastic (5,3,3) is hovering near the 70–80 zone, signaling near-overbought conditions and the potential for brief consolidation. Meanwhile, Bulls Power (13) has turned positive and continues to expand, indicating strengthening buying pressure and sustained bullish momentum in the short term.
Overall, the chart suggests that the sharp decline was likely driven by strong fundamental catalysts such as US dollar strength, rising Treasury yields, or shifting interest rate expectations. The subsequent structured recovery indicates that market sentiment has stabilized, with renewed buying interest emerging after the initial reaction. This price action highlights Golds sensitivity to macroeconomic developments, particularly the monetary policy outlook and broader risk sentiment, which continue to shape its short-term volatility and overall direction.
Market Observation & Strategy Advice
1. Current Position: XAUUSD (H1) is trading around 5025, extending its recovery from the 4878 low. Price remains above the moving average, maintaining a short-term bullish structure.
2. Resistance Zone: Immediate resistance is located at 5046, with stronger resistance around 5083–5096, marking the origin of the previous sharp decline.
3. Support Zone: The key support zone is seen at 4878, aligned with the prior rebound base.
4. Indicator Observation: Bollinger Bands show stabilizing volatility, Parabolic SAR remains below price, Stochastic is near overbought territory, and Bulls Power stays positive—indicating bullish momentum with consolidation risk.
5. Trading Strategy Suggestions:
Bullish Scenario: Consider buy-on-dip positions while price holds above 4990, targeting 5046–5083 as the next upside objective.
Breakout Opportunity: A clear move above 5083 may open room for further upside toward 5119.
Bearish Risk: A decisive break below 4990 could signal a deeper corrective pullback toward 4878.
Market Performance:
Precious Metals Last Price % Change
XPTUSD 2,038.36 −0.33%
XAGUSD 76.4885 −1.25%
Todays Key Economic Calendar:
JP: GDP Growth Annualized & GDP Growth Rate QoQ (Preliminary)
CN: FDI (YTD) YoY
EU: Industrial Production MoM
CA: Housing Starts
US: Fed Bowman Speech
Risk Disclaimer: This report is for informational purposes only and does not constitute financial advice. Investments involve risks, and past performance does not guarantee future results. Consult your financial advisor for personalized investment strategies.
Disclaimer:
Le opinioni di questo articolo rappresentano solo le opinioni personali dell’autore e non costituiscono consulenza in materia di investimenti per questa piattaforma. La piattaforma non garantisce l’accuratezza, la completezza e la tempestività delle informazioni relative all’articolo, né è responsabile delle perdite causate dall’uso o dall’affidamento delle informazioni relative all’articolo.
WikiFX Trader
WikiFX Trader
Rate Calc
USD

CNY
Tasso di cambio attuale:0
inserisci l'importo
USD
A disposizione
CNY
Calcolare 