
Broker Globale Piattaforma di Verifica Regolamentare
WikiFX
English
简体中文
繁體中文
English
Pусский
日本語
ภาษาไทย
Tiếng Việt
Bahasa Indonesia
Español
हिन्दी
Filippiiniläinen
Français
Deutsch
Português
Türkçe
한국어
العربية
DBG Markets: Market Report for Feb 16, 2026
Sommario:From Inflation to AI Fatigue: A Week of Sector RotationUS Dollar, Precious Metal Equities Weekly OutlookLooking back at Friday, the highly anticipated US CPI data came in slightly below expectations
From Inflation to AI Fatigue: A Week of Sector RotationUS Dollar, Precious Metal & Equities Weekly Outlook
Looking back at Friday, the highly anticipated US CPI data came in slightly below expectations (2.4% vs. 2.7% previous), effectively cooling recent "inflation panic" and allowing US equities to stabilize. The US Dollar also showed signs of stabilization with limited movement as the market continued to digest a series of heavy-hitting data points from earlier this month.
With US markets closed on Monday for Presidents' Day, liquidity may be thin in early trading. However, the calendar remains packed with second-tier data and the crucial FOMC minutes, which are set to dictate the next leg of the 2026 narrative.
Key Market Events: The Post-NFP Reality Check
This week, the market's focus shifts from raw employment numbers to inflation sustainability and growth resilience. The primary "stress tests" for market sentiment will occur mid-to-late week:
· FOMC Meeting Minutes (Wednesday, Feb 18): Following the recent inflation and labor prints, investors will scrutinize the minutes for clues on internal divisions. The key is how many members favor a "Higher for Longer" stance versus those concerned about a potential growth cliff.
· U.S. Q4 GDP & Core PCE (Friday, Feb 20): These are the final pieces of the puzzle. If GDP remains robust (above 3.0%) and Core PCE shows signs of stickiness, any lingering hopes for an early summer rate cut will likely evaporate.
· Geopolitical Friction: Maintain a close watch on U.S.-Canada trade tensions. President Trumps veto threat over the tariff bill remains a high-impact "wild card" that could spark sudden volatility in industrial and commodity sectors.
Outlook for the U.S. Dollar: Defensive Resilience
The U.S. Dollar Index successfully reclaimed its footing near 96.80 following the NFP surprise. However, it remains locked in a technical tug-of-war as long as it holds below the 97.00 handle.
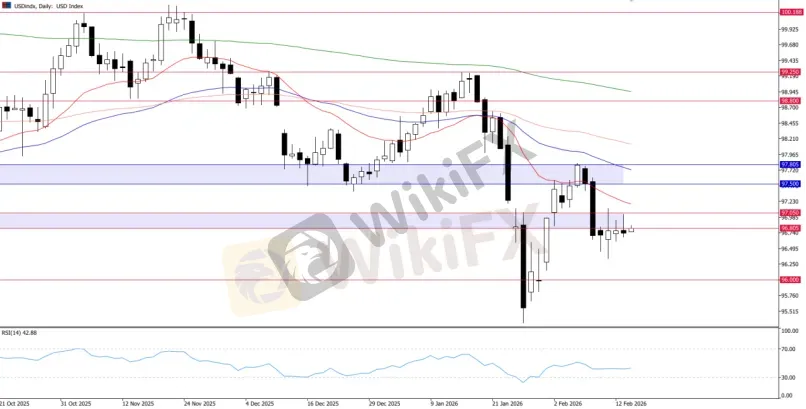
USD Index, Daily Chart
Technically, 97.00 remains the "Iron Ceiling." A decisive daily close above this zone is required to confirm a structural shift into a broader bullish reversal.
· Outlook: Expect the Dollar to trade with a slightly bullish bias as the market continues to price out rate cuts until July 2026.
· Caveat: Without a "hot" GDP or inflation print this Friday, the Greenback may struggle to sustain a rally above 97.50, given that the broader structure still leans toward a bearish move.
Gold & Silver: Reclaiming the Pivot?
The precious metals market is currently undergoing a structural repricing. We need further price action confirmation alongside a fundamental catalyst to determine the next directional leg.
Gold Outlook
Gold's recent reclaim of the $5,000 handle has temporarily eased immediate downside pressure. This move has shifted the technical landscape from a directional bias to a range-bound environment.
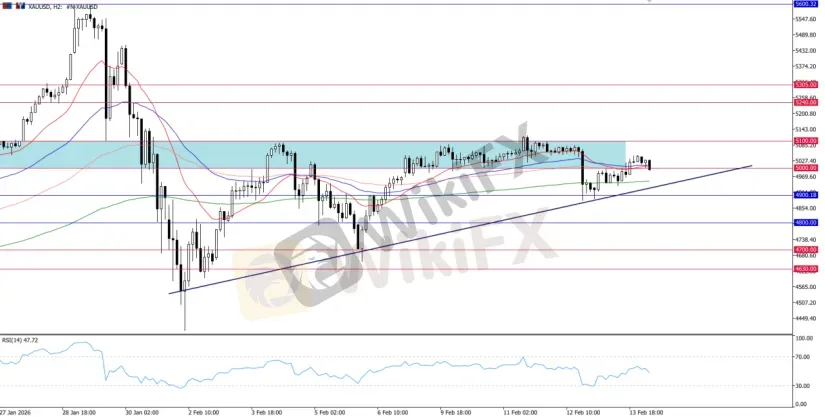
XAUUSD, H2 Chart
Technically, gold is trading near the $5000 pivot, and the $4900 – $4800 zone remains the current major accumulation zone. The formation of an ascending triangle suggests that buyers still dominate much of the strength.
For now, gold needs to reclaim above the $5000 pivot to 5100 to negate the bearish pressure; until then, the near-term move could be range-bound. Conversely, a break below 4900 or the lower triangle trendline may suggest a deeper correction.
Silver Outlook
Silver is mirroring Gold but with higher volatility; however, the mirroring of the upside is less obvious.
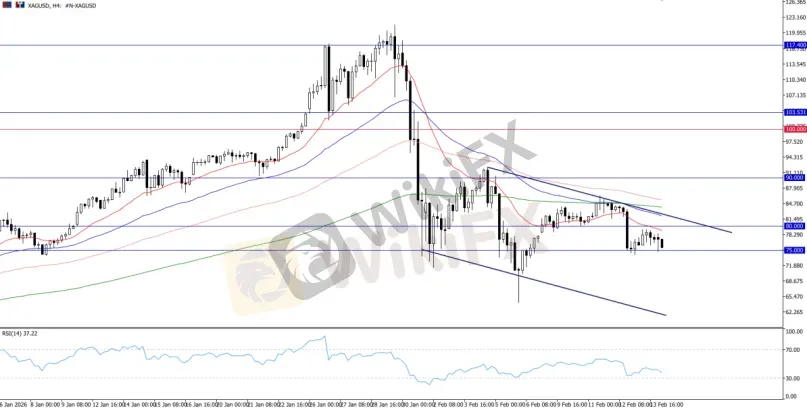
XAGUSD, H4 Chart
As for now, 80 remains the line in the sand. A failure to hold 80 could still lead to a deeper slide toward the 65 – 70 support area, where the recent downtrend channel range can be focused.
Outlook for US Indices: the AI Fatigue
U.S. equities are facing a "Sector Rotation" as high-beta Tech names lose steam in favor of "Old Economy" and defensive sectors.
The tech sector is facing a "perfect storm" of "higher for longer" interest rates. Investors are actively pricing in concerns that new AI models may "cannibalize" traditional software revenue and the DOJ antitrust investigation into Nvidia. This could continue to pressure tech indices like the Nasdaq this week.
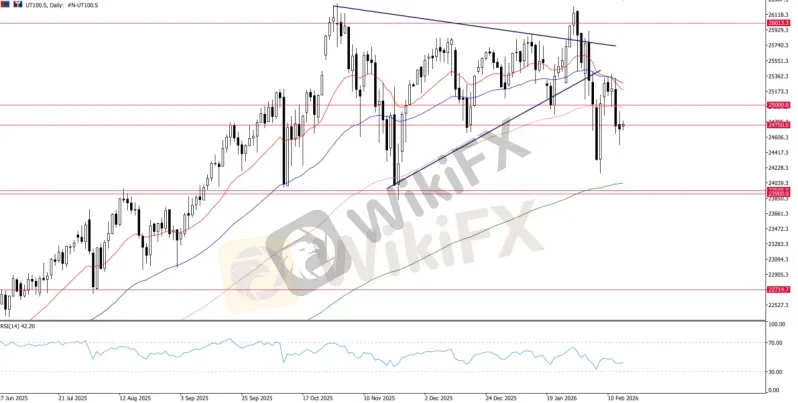
UT100, Daily Chart
25,000 is the ultimate support. A weekly close below this would signal a regime shift and a potential technical correction toward 24,000.
Sector rotation risks and technical uncertainty in the tech field continue to pressure the index, with the 25,000 mark remaining the key level to watch for the short-term outlook.
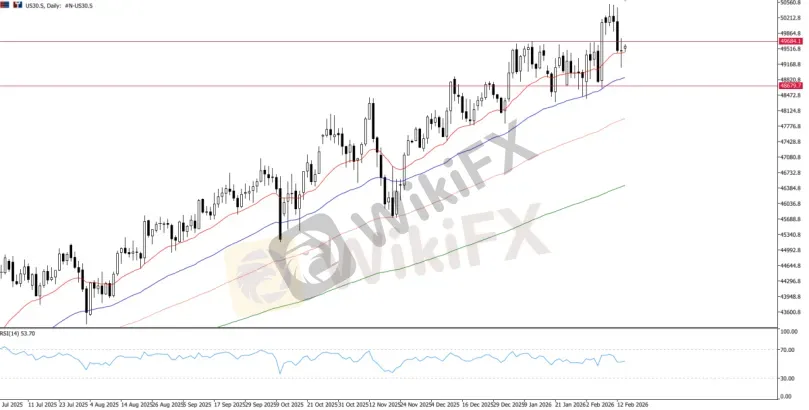
US30, Daily Chart
Meanwhile, the Dow Jones is the standout performer, having recently touched 50,000.
However, while it remains the "Haven" within equities, the failure to hold 50,000 on a closing basis suggests that even the blue chips are feeling the weight of the "Higher for Longer" narrative. If even the Dow Jones faces pressure, broad pressure in the US equities market is likely.

Disclaimer:
Le opinioni di questo articolo rappresentano solo le opinioni personali dell’autore e non costituiscono consulenza in materia di investimenti per questa piattaforma. La piattaforma non garantisce l’accuratezza, la completezza e la tempestività delle informazioni relative all’articolo, né è responsabile delle perdite causate dall’uso o dall’affidamento delle informazioni relative all’articolo.
WikiFX Trader
EBC FINANCIAL GROUP
Sotto supervisione
AVATRADE
Sotto supervisione
FOREX.com
Supervisione del paese
FXCM
Sotto supervisione
HFM
Sotto supervisione
GTCFX
Sotto supervisione
EBC FINANCIAL GROUP
Sotto supervisione
AVATRADE
Sotto supervisione
FOREX.com
Supervisione del paese
FXCM
Sotto supervisione
HFM
Sotto supervisione
GTCFX
Sotto supervisione
Rate Calc
USD

CNY
Tasso di cambio attuale:0
inserisci l'importo
USD
A disposizione
CNY
Calcolare 