简体中文
繁體中文
English
Pусский
日本語
ภาษาไทย
Tiếng Việt
Bahasa Indonesia
Español
हिन्दी
Filippiiniläinen
Français
Deutsch
Português
Türkçe
한국어
العربية
GBPUSD analysis for 25.10.2023
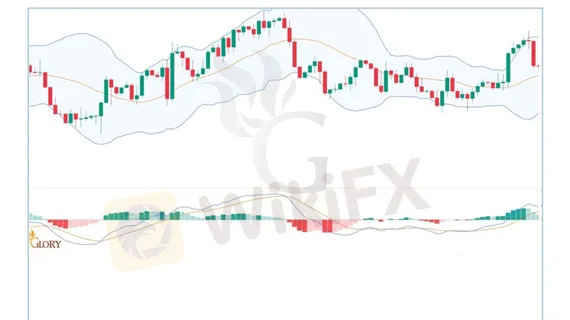
Sommario:The GBPUSD chart indicates positive upward momentum as it shows a recent rebound from the lower Bollinger Band and is now moving towards the upper band. These observations suggest a possible bullish trend in the price movement.

The GBPUSD chart indicates positive upward momentum as it shows a recent rebound from the lower Bollinger Band and is now moving towards the upper band. These observations suggest a possible bullish trend in the price movement.
Moreover, the MACD demonstrates a bullish crossover, with the MACD line surpassing the signal line, reinforcing the upward momentum. The histogram turning positive further supports this bullish sentiment. Traders should monitor for potential resistance at the upper Bollinger Band.
• There is a resistance level at 1.22878; followed by resistance at 1.24243 and 1.27392.
• There is a support level at 1.20380 Below, there are 1.20952 and 1.21603.

Disclaimer:
Le opinioni di questo articolo rappresentano solo le opinioni personali dell’autore e non costituiscono consulenza in materia di investimenti per questa piattaforma. La piattaforma non garantisce l’accuratezza, la completezza e la tempestività delle informazioni relative all’articolo, né è responsabile delle perdite causate dall’uso o dall’affidamento delle informazioni relative all’articolo.
WikiFX Trader
GRIC FX
TVR
GO MARKETS
MTFE
OSIRIS FOREX
FP Markets
GRIC FX
TVR
GO MARKETS
MTFE
OSIRIS FOREX
FP Markets
WikiFX Trader
GRIC FX
TVR
GO MARKETS
MTFE
OSIRIS FOREX
FP Markets
GRIC FX
TVR
GO MARKETS
MTFE
OSIRIS FOREX
FP Markets
Rate Calc

