

عالمی بروکر ریگولیشن چیک کرنے والا ایپ
WikiFX
اردو
简体中文
繁體中文
English
Pусский
日本語
ภาษาไทย
Tiếng Việt
Bahasa Indonesia
Español
हिन्दी
Filippiiniläinen
Français
Deutsch
Português
Türkçe
한국어
العربية
اردو


FPG EURUSD Market Report September 16, 2026


خلاصہ:On the H1 chart, EURUSD appears to be transitioning into a consolidation phase following a fairly prolonged bearish run. The decline originated from the 1.1653 region and pushed the pair steadily lowe
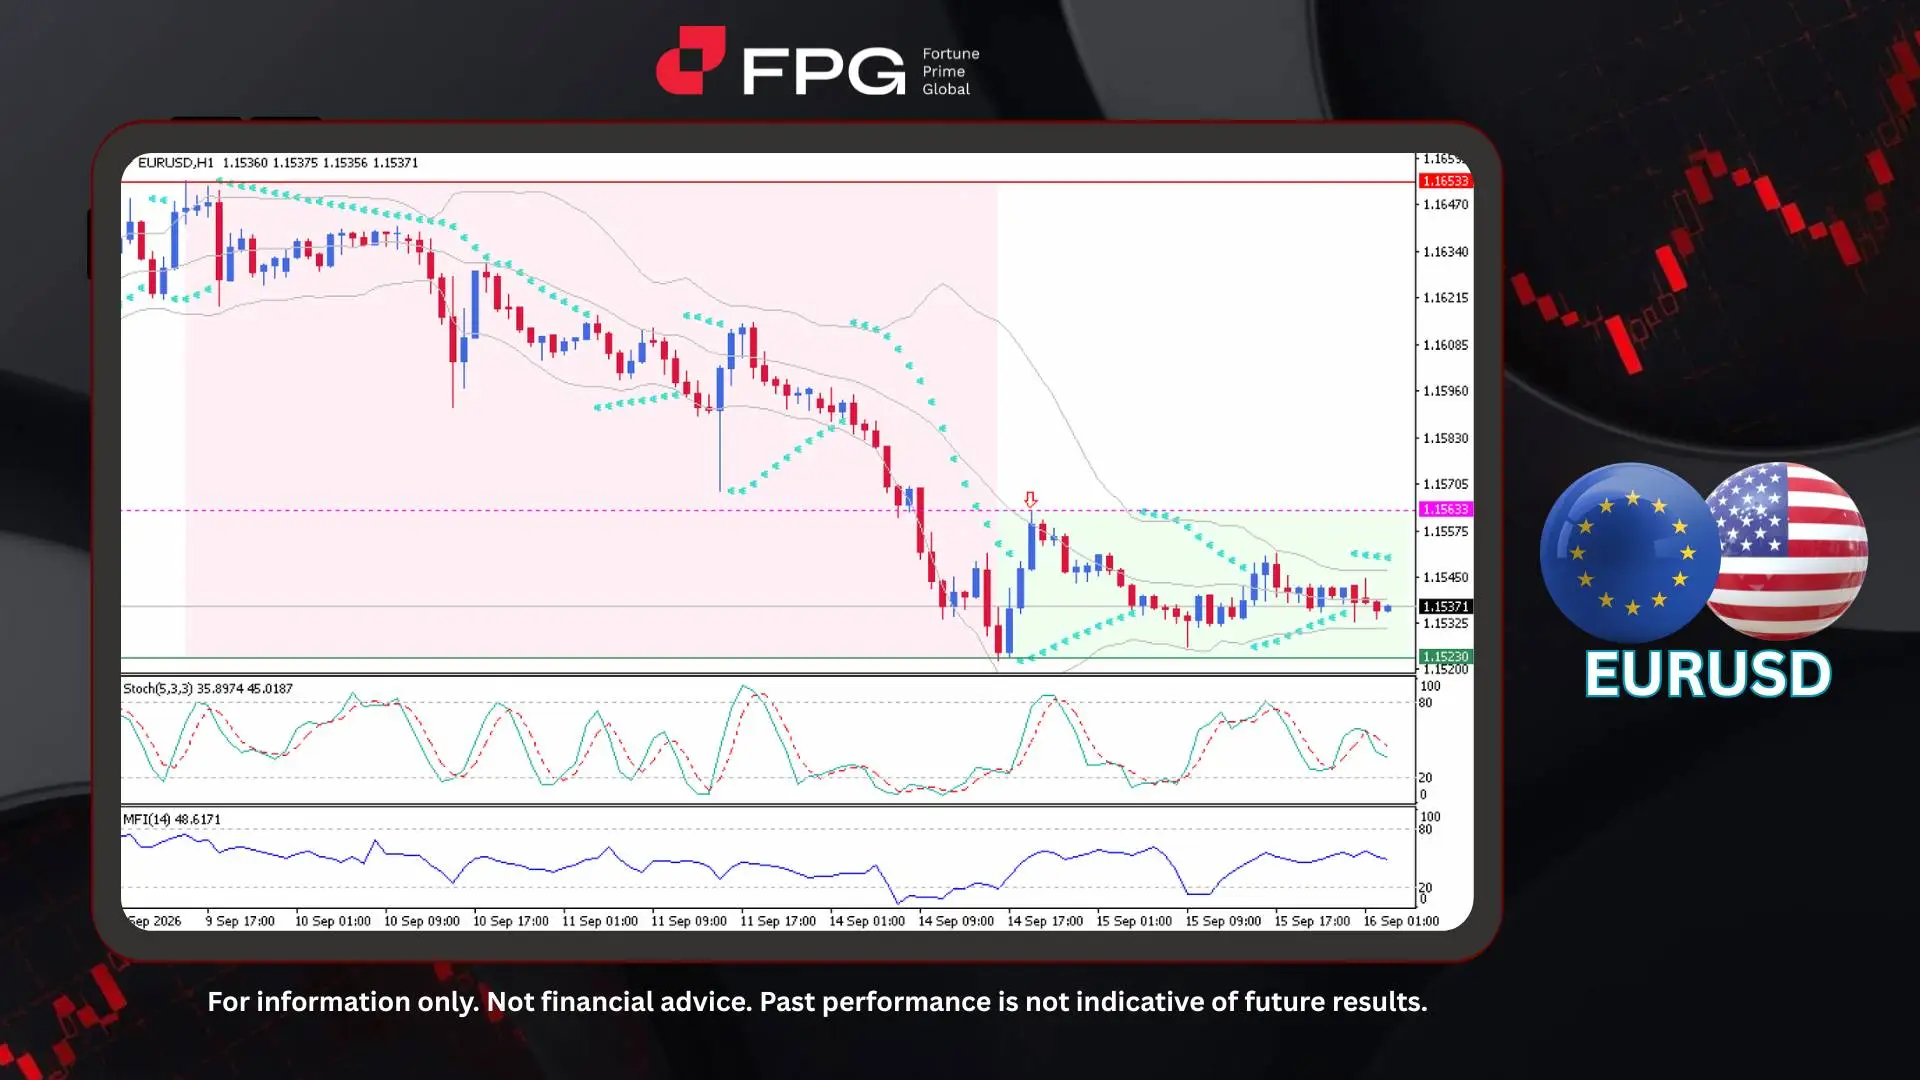
On the H1 chart, EURUSD appears to be transitioning into a consolidation phase following a fairly prolonged bearish run. The decline originated from the 1.1653 region and pushed the pair steadily lower to a recent low near 1.1523. Price is now hovering around 1.1537, trading within a sideways range, with the nearest resistance located at 1.1563.
Technically, the picture supports this stabilization narrative. The Bollinger Bands have begun to narrow, pointing to easing volatility and diminished directional conviction following the prior sell-off. The Parabolic SAR has also flipped back above price action, signaling renewed bearish momentum and suggesting that downside pressure may persist. The Stochastic Oscillator (5,3,3) is moving upward from oversold territory, with %K and %D readings near 36 and 45 respectively, suggesting a shift toward more neutral momentum within the range. Meanwhile, the Money Flow Index (14) sits near the midpoint at 48.6, reflecting a relatively balanced tug-of-war between buyers and sellers rather than a decisive directional skew.
On the fundamental front, Eurozone data over the past five sessions has painted a mixed picture: German investor sentiment ticked up slightly but remained below expectations, while persistently elevated energy prices continue to weigh on the region's growth outlook. In the US, softer consumer sentiment has offered a partial counterweight to dollar strength, though resilient Treasury yields and expectations surrounding the Federal Reserve's upcoming policy decision continue to underpin the greenback. With inflation and energy-cost pressures still clouding the euro's outlook, EURUSD's move into consolidation reflects the market digesting these competing forces, balancing soft Eurozone fundamentals against evolving US growth and monetary-policy expectations.
Technical Market Overview
1. Current Position: EURUSD is trading around 1.1537 on the H1 timeframe, consolidating after a prolonged bearish rally that extended from 1.1653 down to a low near 1.1523. Price action has flattened into a sideways range following the sharp decline.
2. Resistance Zone: Immediate resistance is identified at 1.1563, marked by the recent swing high and reinforced by the upper boundary of the current consolidation range. A sustained break above this level would be needed to shift the near-term bias back toward bullish continuation, with the next barrier situated at 1.1653.
3. Support Zone: Key support lies at 1.1523, corresponding to the low of the preceding bearish leg. This level has acted as a floor during the recent consolidation, and a decisive break below it would expose the pair to renewed downside pressure.
4. Indicator Observation: The Bollinger Bands are narrowing, indicating contracting volatility and a pause in directional momentum. The Parabolic SAR has flipped above price, signaling renewed bearish momentum. The Stochastic Oscillator (5,3,3) is moving higher from oversold territory, with %K near 36 and %D near 45, suggesting a shift toward more neutral momentum. The Money Flow Index (14) reads 48.6, reflecting a relatively balanced flow between buying and selling pressure.
5. Technical Summary: EURUSD is showing early signs of stabilization after its recent downtrend, with price consolidating between the 1.1523 support and 1.1563 resistance. Momentum indicators are turning cautiously constructive, but the narrowing bands suggest the market is awaiting a fresh catalyst before establishing its next directional move. A breakout above 1.1563 would favor bulls, while a breakdown below 1.1523 would reaffirm bearish continuation.
Market Performance:
Forex Last Price % Change
USD/JPY 155.22 +0.10%
GBP/USD 1.3469 −0.05%
Key Economic Calendar:
US: API Crude Oil Stock Change
JP: Balance of Trade
JP: Exports YoY
JP: Machinery Orders MoM & YoY
UK: Core Inflation Rate YoY
UK: Inflation Rate MoM & YoY
EU: Industrial Production MoM
US: MBA 30-Year Mortgage Rate
CA: Housing Starts
US: Export & Import Prices MoM
US: Retail Sales Control Group & Ex Autos MoM
US: Retail Sales MoM
US: Business Inventories MoM
US: NAHB Housing Market Index
US: EIA Crude Oil & Gasoline Stocks Change
Risk Disclaimer: This report is for informational purposes only and does not constitute financial advice. Investments involve risks, and past performance does not guarantee future results. Consult your financial advisor for personalized investment strategies.
ڈس کلیمر:
یہ مضمون صرف مصنف کی ذاتی رائے پر مبنی ہے، یہ پلیٹ فارم کی سرمایہ کاری کی مشورہ نہیں ہے۔ پلیٹ فارم مضمون کی معلومات کی درستگی، مکملیت اور بروقت ہونے کی کوئی ضمانت نہیں دیتا، اور مضمون کی معلومات پر اعتماد یا استعمال سے ہونے والے کسی بھی نقصان کی ذمہ داری قبول نہیں کرتا۔
