

عالمی بروکر ریگولیشن چیک کرنے والا ایپ
WikiFX
اردو
简体中文
繁體中文
English
Pусский
日本語
ภาษาไทย
Tiếng Việt
Bahasa Indonesia
Español
हिन्दी
Filippiiniläinen
Français
Deutsch
Português
Türkçe
한국어
العربية
اردو


The 20/50 EMA Crossover: Your First Simple Trend-Following System

WikiFX
|


خلاصہ:A beginner-friendly breakdown of how exponential moving averages work and how the 20-period and 50-period EMA combination can create a simple trend-following reference, free from prediction or trading advice.

If you have ever stared at a price chart wondering how to tell if a currency pair is in an uptrend or a downtrend without relying on gut feeling, you are not alone. Many new traders discover that a pair of exponential moving averages, the 20-period and the 50-period EMA, can turn price action into a clear, repeatable trend signal. This article explains what the EMA is, how the 20/50 combination works, and where beginners most often misunderstand it.
 فہرست
فہرستWhat Is the Exponential Moving Average (EMA)?
The exponential moving average is a type of moving average that gives greater weight to the most recent price data. Unlike a simple moving average, which treats every price in the lookback window equally, the EMA applies a multiplier that makes it more responsive to new information. The design motivation is straightforward: traders wanted a smoothing line that reduces lag without becoming too jumpy. When you look at an EMA line on a chart, each point is not just an average – it is a weighted blend of all past prices, where the influence of a price decays exponentially the further back it sits.
The Core Idea: Exponential Smoothing of Prices
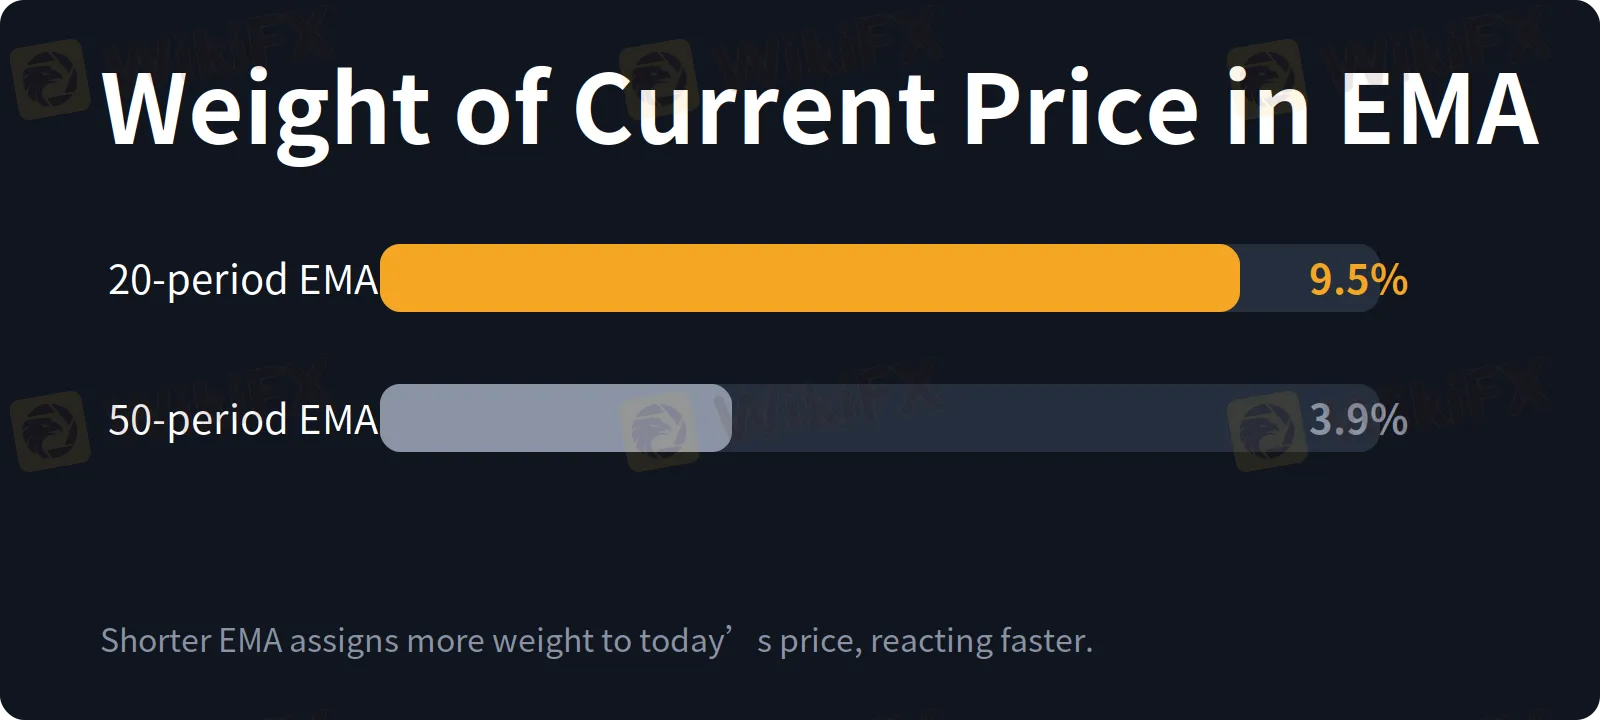
At the heart of the EMA is a technique called exponential smoothing. Instead of dropping an old price entirely when a new period arrives (as a simple moving average does), the EMA incorporates the new price while keeping a memory of the entire series. The weight given to the current price is determined by a smoothing factor, commonly labelled alpha. For a period length N, alpha equals 2 divided by (N + 1). That means a shorter period EMA allocates a larger slice of weight to todays price, making it stick closer to current action. A longer period EMA applies a smaller alpha, so it reacts more slowly and acts as a smoother trend filter.
How EMAs Are Calculated
The standard formula for an EMA is recursive, which means it builds each new value from the previous one. The equation is:
EMA_today = (Price_today × alpha) + (EMA_yesterday × (1 - alpha))
To compute it step by step:
- Choose a period N and calculate alpha = 2 / (N + 1).
- Seed the first EMA value. Most charting platforms use a simple moving average of the first N closing prices as the initial EMA.
- Apply the formula for each subsequent period, always feeding the previous EMA value into the calculation.
Limitations and Common Misunderstandings of EMA Crossovers
The biggest trap for a beginner is to treat every crossover as an entry signal. EMAs are lagging indicators because they are built from past prices. By the time the crossover appears on the chart, a part of the move has already happened. In a ranging, directionless market the 20 and 50 EMAs can weave back and forth, generating a series of false crosses that quickly reverse. A crossover alone does not guarantee a sustained trend; it only tells you that momentum has shifted in the recent lookback window.
Another misunderstanding is believing that the 20/50 combination works identically across all currency pairs and timeframes. While the concept of a fast and a slow EMA remains the same, the right period choices depend heavily on the markets rhythm. On a 5-minute chart, a 50-period EMA reacts much more quickly than on a daily chart, and a crossover may occur every few hours, often during low-liquidity periods. On a weekly chart, a 20/50 crossover might appear only a few times a year. Changing the timeframe changes the signal frequency and the size of whipsaws, not the core mathematics.
What the 20/50 EMA Crossover Is – and Is Not
Think of the 20/50 EMA crossover as a trend filter, not as a crystal ball. It helps you answer the question, “Which way is the market leaning right now?” with mechanical consistency. It does not predict how far a trend will run, and it does not tell you where to place a stop-loss or when to exit. Used wisely, it can form the backbone of a simple, rules-based system where you only look for buy opportunities when the 20 is above the 50, and only sell setups when the reverse is true. Used blindly, it will lead to the same frustrations as any indicator taken out of context. The goal is not to find the perfect indicator; it is to build a framework you can follow without emotion.
ڈس کلیمر:
یہ مضمون صرف مصنف کی ذاتی رائے پر مبنی ہے، یہ پلیٹ فارم کی سرمایہ کاری کی مشورہ نہیں ہے۔ پلیٹ فارم مضمون کی معلومات کی درستگی، مکملیت اور بروقت ہونے کی کوئی ضمانت نہیں دیتا، اور مضمون کی معلومات پر اعتماد یا استعمال سے ہونے والے کسی بھی نقصان کی ذمہ داری قبول نہیں کرتا۔
WIKIFX بروکر
ہاٹ نیوز
GBP/USD میں 1.3500 کے اوپر مضبوطی، UK کی بہتر معاشی رپورٹ سے Pound کو سہارا
WikiFXپاکستان میں جولائی 2026 کے دوران زرعی درآمدات میں اہم تبدیلیاں
WikiFX