

عالمی بروکر ریگولیشن چیک کرنے والا ایپ
WikiFX
اردو
简体中文
繁體中文
English
Pусский
日本語
ภาษาไทย
Tiếng Việt
Bahasa Indonesia
Español
हिन्दी
Filippiiniläinen
Français
Deutsch
Português
Türkçe
한국어
العربية
اردو
FPG USDCAD Market Report June 17, 2026
خلاصہ۔:On the H4 timeframe chart, USDCAD continues to exhibit a strong and well-established bullish trend. The upward movement originated in early May following a decisive trend reversal from bearish to bull
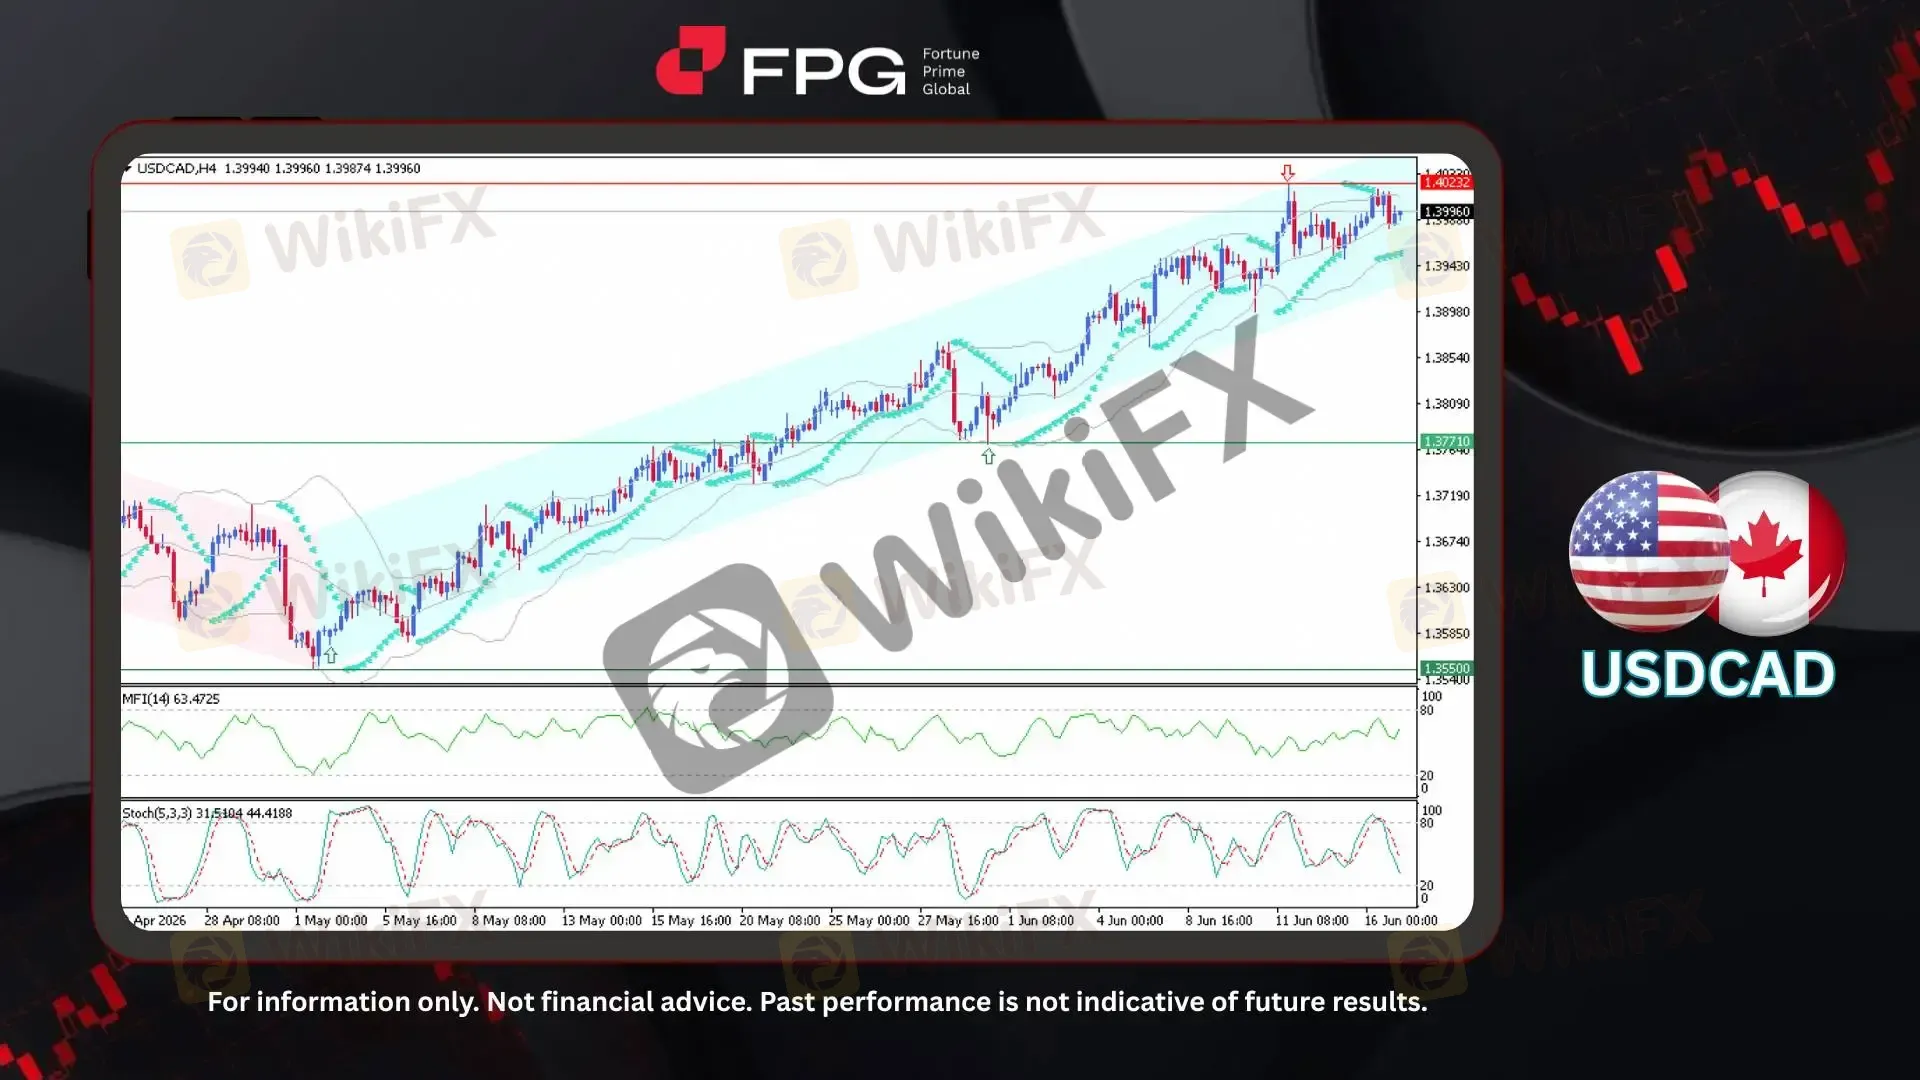
On the H4 timeframe chart, USDCAD continues to exhibit a strong and well-established bullish trend. The upward movement originated in early May following a decisive trend reversal from bearish to bullish near the 1.3550 level. Since then, the pair has advanced steadily within a well-defined ascending channel, supported by a consistent pattern of higher highs and higher lows. At the time of writing, USDCAD is trading around 1.3996, approaching the immediate resistance level at 1.4023. Despite minor short-term fluctuations, the overall price structure remains constructive, indicating that bullish sentiment continues to dominate the broader market outlook.
Technical indicators remain broadly supportive of the prevailing uptrend, although momentum has moderated as price approaches a key resistance zone. The Parabolic SAR continues to track below the current price action, reinforcing the strength of the existing bullish structure and confirming that buyers remain in control of the medium-term trend. Meanwhile, the Money Flow Index (MFI) is holding above the neutral threshold at approximately 63, reflecting sustained capital inflows and underlying buying interest. However, the Stochastic Oscillator has turned lower after reaching overbought territory, suggesting that upward momentum may be easing and that a period of consolidation or a modest corrective pullback could occur before the next directional move develops.
Recent economic developments have continued to favor the U.S. dollar relative to the Canadian dollar. In Canada, the Bank of Canada has maintained a cautious policy stance amid ongoing trade uncertainties, softer oil prices, and persistent inflationary pressures, while domestic economic data have delivered mixed signals regarding the strength of economic growth. In contrast, resilient labor market conditions and persistent inflation in the United States have reinforced expectations that interest rates could remain elevated for an extended period, supporting demand for the U.S. dollar. Combined with heightened geopolitical risks, risk-off sentiment, and declining oil prices, these factors have contributed to the sustained strength of USDCAD, allowing the pair to maintain its bullish trajectory since early May.
Technical Market Overview
1. Current Position: USDCAD is currently trading around 1.3996 on the H4 timeframe, maintaining its position within a well-defined ascending channel. The broader trend remains bullish, supported by a consistent pattern of higher highs and higher lows since the reversal from the 1.3550 area.
2. Resistance Zone: The nearest resistance level is located at 1.4023, which recently capped further upside attempts. A decisive breakout above this level could reinforce bullish momentum and expose the next upside targets within the ascending channel.
3. Support Zone: Immediate support is located around the 1.3970–1.3950 area, where recent consolidation has taken place. A deeper pullback could find stronger support near 1.3771, which remains a key structural level within the current uptrend.
4. Indicator Observation: The Parabolic SAR remains below price action and the MFI is holding above the neutral 50 level, indicating that the broader bullish bias remains intact. However, the Stochastic Oscillator has turned lower from overbought territory, suggesting that short-term momentum is moderating.
5. Technical Summary: The overall technical outlook remains bullish as long as price continues to trade within the ascending channel and above key support levels. Although a period of consolidation or a modest pullback may occur in the near term, the prevailing trend continues to favor further upside potential.
Market Performance:
Forex Last Price % Change
EUR/USD 1.1611 +0.03%
USD/JPY 160.42 +0.03%
Key Economic Calendar:
US: API Crude Oil Stock Change
JP: Balance of Trade
JP: Exports YoY
JP: Machinery Orders MoM & YoY
AU: RBA Jones Speech
UK: Core Inflation Rate YoY
UK: Inflation Rate MoM & YoY
CN: FDI (YTD) YoY
EU: ECB President Lagarde Speech
US: MBA 30-Year Mortgage Rate
CA: New Housing Price Index MoM
US: Retail Sales Control Group & Ex Autos MoM
US: Retail Sales MoM
US: Business Inventories MoM
US: Pending Home Sales MoM & YoY
US: EIA Crude Oil & Gasoline Stocks Change
Risk Disclaimer: This report is for informational purposes only and does not constitute financial advice. Investments involve risks, and past performance does not guarantee future results. Consult your financial advisor for personalized investment strategies.
ڈس کلیمر:
یہ مضمون صرف مصنف کی ذاتی رائے پر مبنی ہے، یہ پلیٹ فارم کی سرمایہ کاری کی مشورہ نہیں ہے۔ پلیٹ فارم مضمون کی معلومات کی درستگی، مکملیت اور بروقت ہونے کی کوئی ضمانت نہیں دیتا، اور مضمون کی معلومات پر اعتماد یا استعمال سے ہونے والے کسی بھی نقصان کی ذمہ داری قبول نہیں کرتا۔
WIKIFX بروکر
ایکسچینج ریٹ کا حساب
USD

CNY
موجودہ ایکسچینج ریٹ:0
براہ کرم رقم درج کریں۔
USD
تبادلہ کے قابل رقم
CNY
حساب شروع کریں 