
عالمی بروکر ریگولیشن چیک کرنے والا ایپ
WikiFX
اردو
简体中文
繁體中文
English
Pусский
日本語
ภาษาไทย
Tiếng Việt
Bahasa Indonesia
Español
हिन्दी
Filippiiniläinen
Français
Deutsch
Português
Türkçe
한국어
العربية
اردو


FPG BTCUSD Market Report June 3, 2026


خلاصہ۔:On the Daily timeframe chart, BTCUSD has experienced a significant bearish decline, falling from the 77,998 resistance area toward 66,093 after previously reaching a major peak around 82,819. Followin
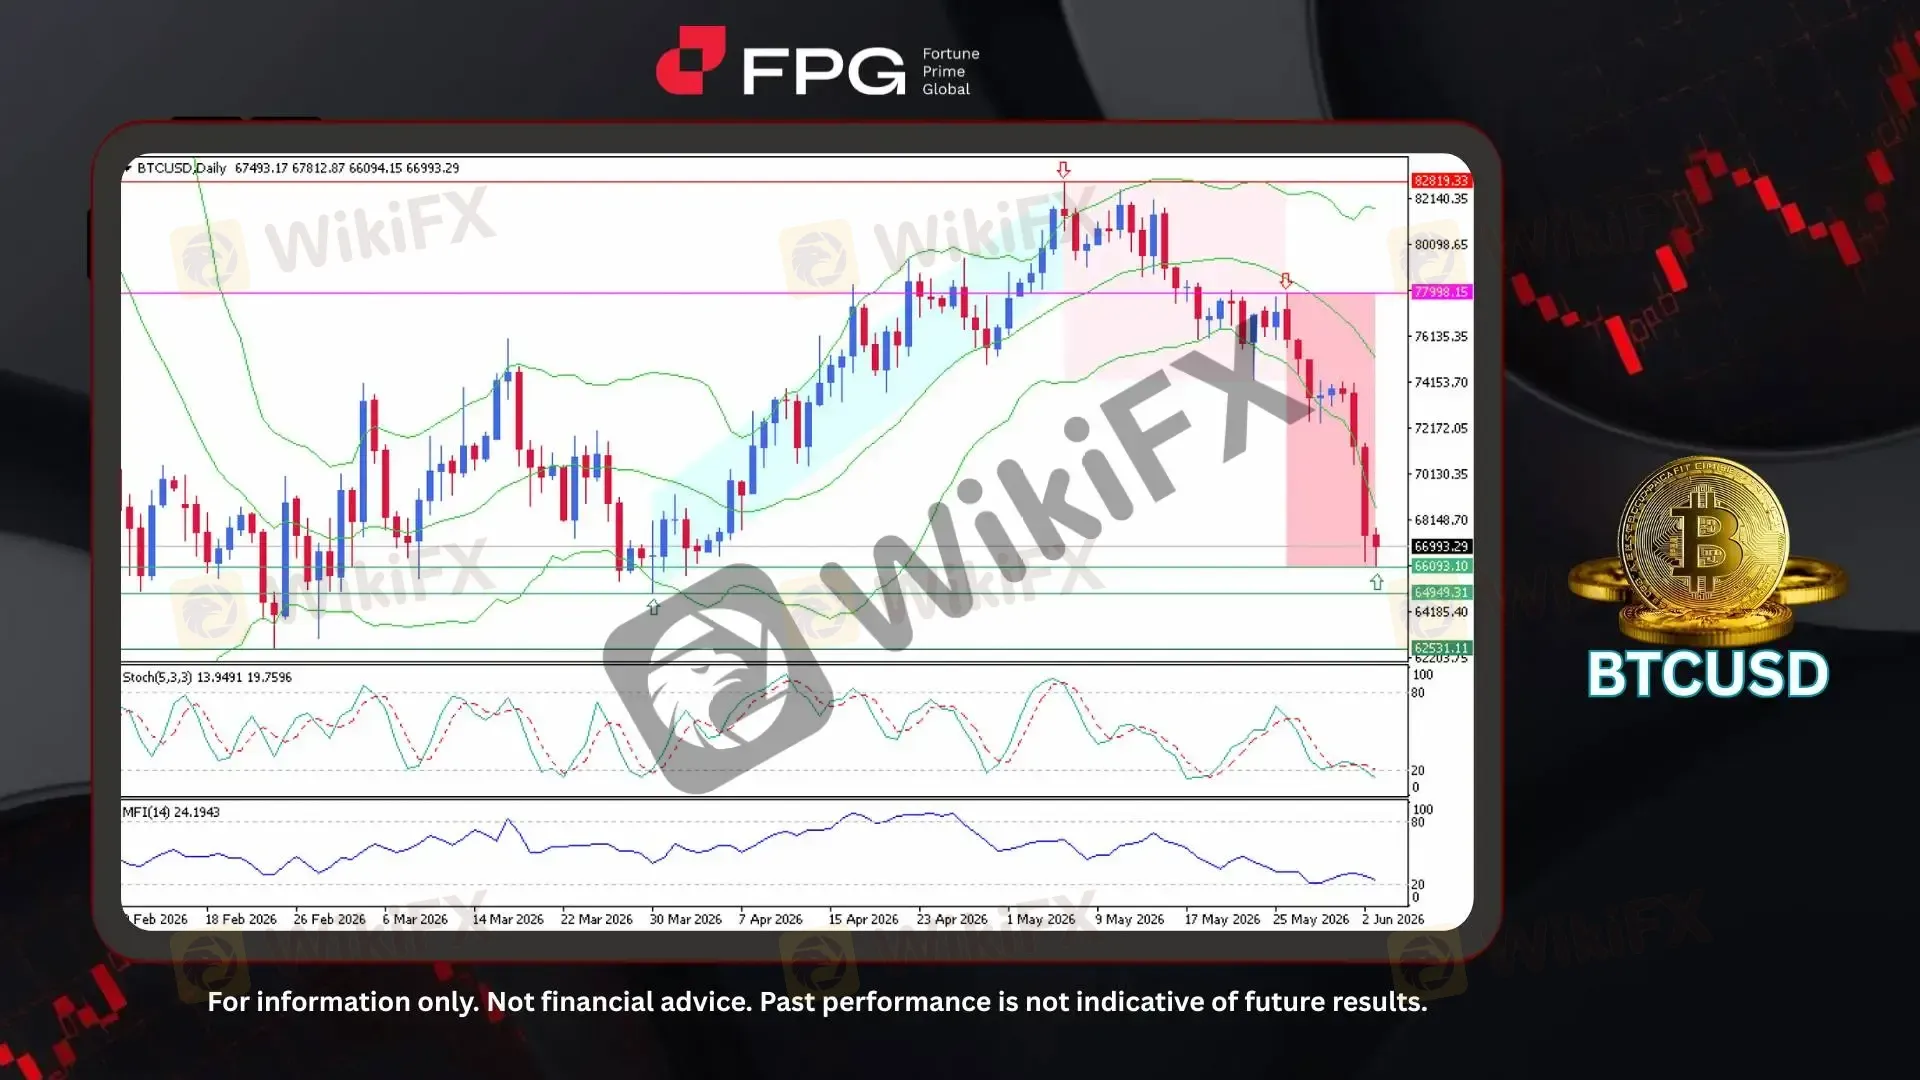
On the Daily timeframe chart, BTCUSD has experienced a significant bearish decline, falling from the 77,998 resistance area toward 66,093 after previously reaching a major peak around 82,819. Following the failure to sustain bullish momentum near the upper resistance zone, Bitcoin entered a clear reversal phase and gradually developed a bearish structure characterized by lower highs and lower lows. The latest decline pushed price toward the 66,000 support area, where BTCUSD is currently trading around 66,993 with elevated volatility. Although the price is showing temporary stabilization near support, the overall structure remains under bearish pressure as sellers continue to dominate the recent market movement.
From a technical perspective, BTCUSD remains in a weak bearish phase after breaking below the previous consolidation area around 77,998. Bollinger Bands are currently expanding, reflecting increased volatility following the sharp selloff, while price is trading near the lower band area, indicating strong downside pressure but also increasing the possibility of a short-term technical rebound. The Stochastic Oscillator (5,3,3) is currently around 13.95 and 19.76, showing that momentum has entered oversold territory and suggesting that selling pressure may temporarily slow. Meanwhile, the MFI (14) is around 24.19, reflecting weak buying interest and limited capital inflow into Bitcoin. Overall, indicators confirm dominant bearish momentum, although oversold conditions may trigger a corrective movement if buyers begin to regain strength.
Bitcoin continues to face pressure from weaker risk appetite, cautious investor sentiment, and uncertainty surrounding the broader macroeconomic environment. Recent market concerns have been influenced by institutional fund outflows, slowing liquidity conditions, and reduced demand for high-risk assets as investors remain focused on global economic developments and monetary policy expectations. Additional concerns regarding long-term blockchain security risks from advancing quantum computing technology have also contributed to a more defensive market environment. These factors continue to weigh on BTCUSD, while traders remain cautious ahead of upcoming economic data and market catalysts that could determine the next major direction.
Technical Market Overview
1. Current Position: BTCUSD is currently trading around 66,993 after declining sharply from the 77,998 resistance zone. Price action remains within a bearish structure, although the latest movement shows temporary stabilization near the 66,000 support area after the aggressive selloff.
2. Resistance Zone: Immediate resistance zone is seen around 77,998, representing the previous consolidation level and major supply area where sellers previously regained control.
3. Support Zone: Nearest support is identified at 66,093, which currently acts as the main short-term support following the recent decline. A deeper support zone lies around 64,949–62,531, representing previous structural support areas that could become the next downside targets if bearish pressure continues.
4. Indicator Observation: Technical indicators continue reflecting a bearish market condition. Bollinger Bands remain expanded, indicating elevated volatility following the sharp decline, with price holding near the lower band. The Stochastic Oscillator (5,3,3) is deep in oversold territory at 13.95 and 19.76, suggesting that downside momentum remains strong but may face short-term correction risk. Meanwhile, MFI (14) remains weak around 24.19, indicating limited buying activity and continued cautious sentiment.
5. Technical Summary: Overall, BTCUSD maintains a bearish bias after failing to sustain movement above the 77,998 resistance zone and entering a strong downward trend. Current oversold conditions near support may create a temporary rebound or consolidation phase, but the broader structure remains negative unless price recovers above key resistance levels. A confirmed break below 66,093 could open further downside potential toward 64,949 and 62,531, while a recovery above 70,130 may provide early signals of short-term bullish correction.
Market Performance:
Crypto Last Price % Change
ETHUSD 1,864.5 +0.38%
SOLUSD 74.68 +0.76%
Today's Key Economic Calendar:
US: API Crude Oil Stock Change
AU: Ai Group Industry Index
AU: GDP Growth Rate QoQ & YoY
CN: RD Services PMI
JP: BoJ Gov Ueda Speech
US: MBA 30-Year Mortgage Rate
US: ADP Employment Change
US: Fed Barr Speech
US: Factory Orders MoM
US: ISM Services PMI
US: EIA Crude Oil & Gasoline Stocks Change
US: Fed Goolsbee Speech
Risk Disclaimer: This report is for informational purposes only and does not constitute financial advice. Investments involve risks, and past performance does not guarantee future results. Consult your financial advisor for personalized investment strategies.
ڈس کلیمر:
یہ مضمون صرف مصنف کی ذاتی رائے پر مبنی ہے، یہ پلیٹ فارم کی سرمایہ کاری کی مشورہ نہیں ہے۔ پلیٹ فارم مضمون کی معلومات کی درستگی، مکملیت اور بروقت ہونے کی کوئی ضمانت نہیں دیتا، اور مضمون کی معلومات پر اعتماد یا استعمال سے ہونے والے کسی بھی نقصان کی ذمہ داری قبول نہیں کرتا۔
