

عالمی بروکر ریگولیشن چیک کرنے والا ایپ
WikiFX
اردو
简体中文
繁體中文
English
Pусский
日本語
ภาษาไทย
Tiếng Việt
Bahasa Indonesia
Español
हिन्दी
Filippiiniläinen
Français
Deutsch
Português
Türkçe
한국어
العربية
اردو
FPG USDCAD Market Report April 30, 2026
خلاصہ۔:On the H1 timeframe chart, USDCAD shows that around last week there was a bearish price drop from 1.3713 to 1.3596, establishing a clear short-term downside structure. From that low point, a trend rev
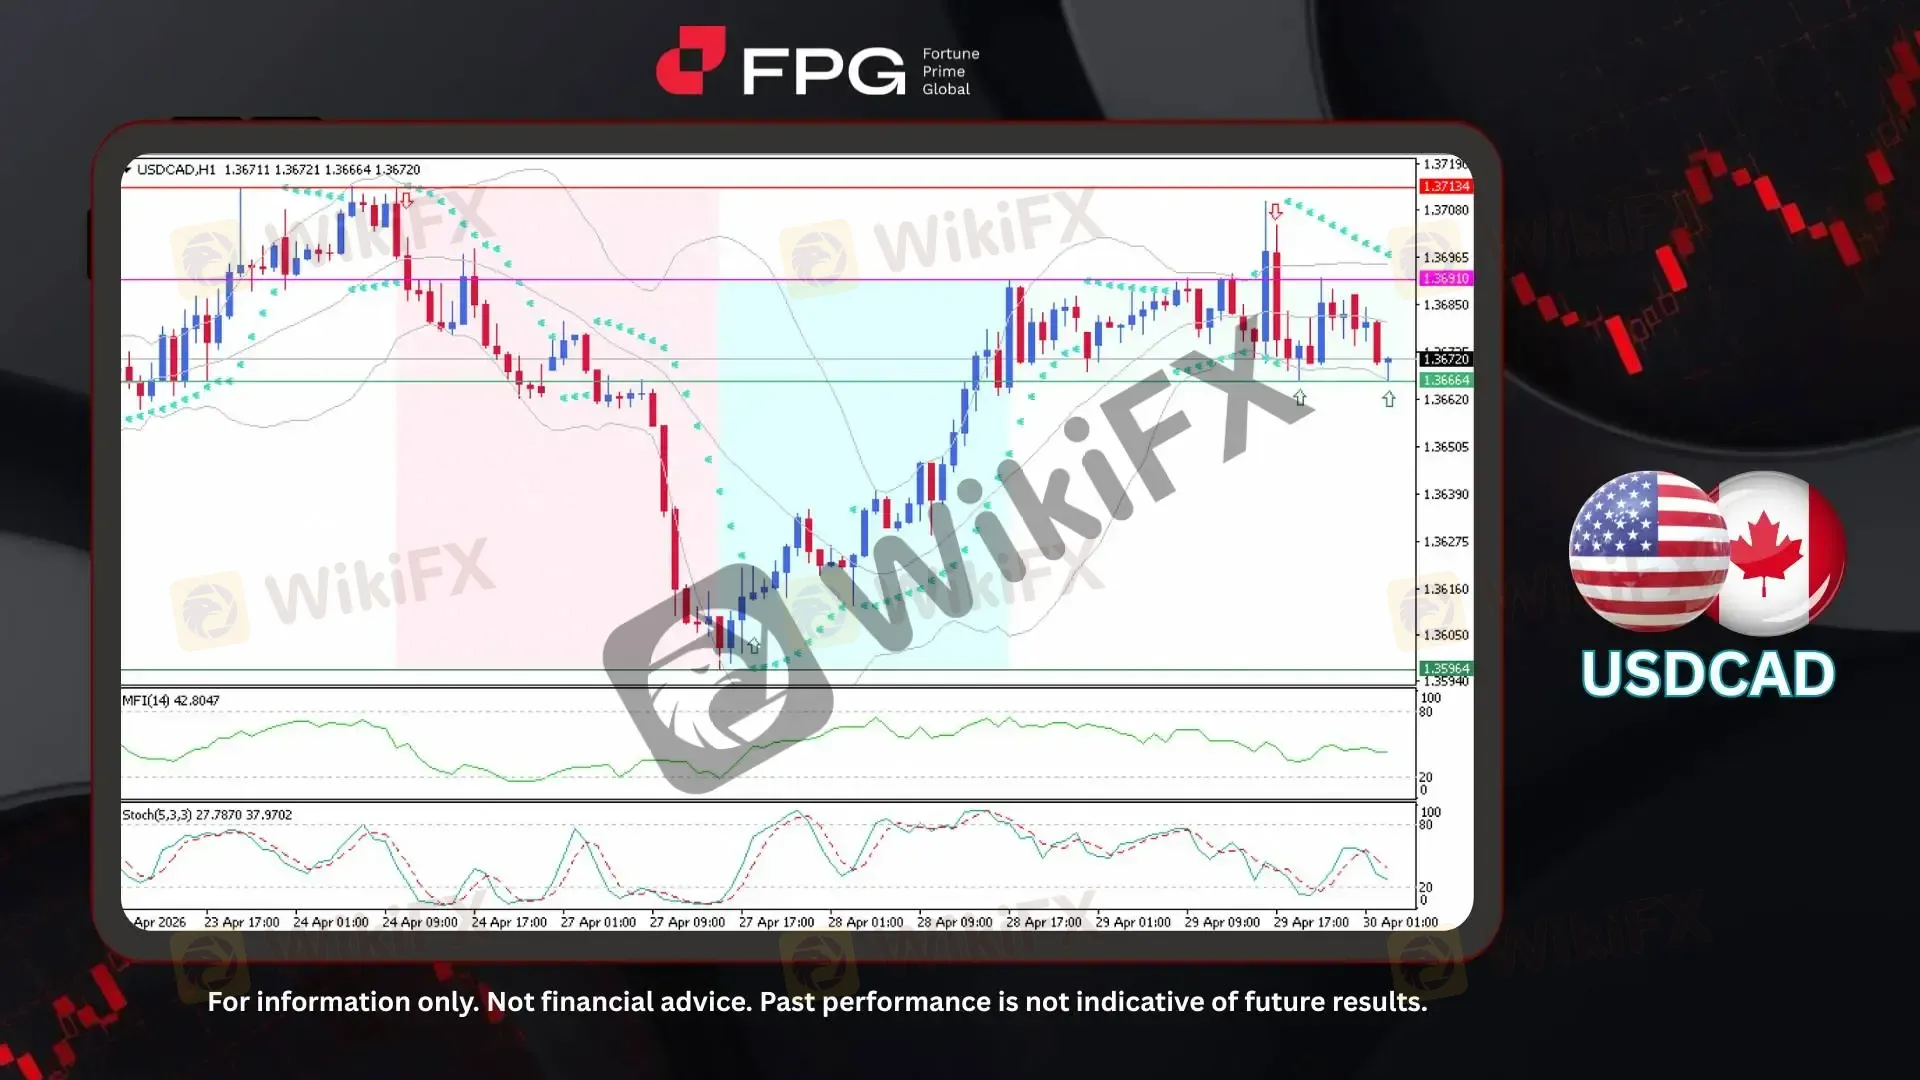
On the H1 timeframe chart, USDCAD shows that around last week there was a bearish price drop from 1.3713 to 1.3596, establishing a clear short-term downside structure. From that low point, a trend reversal occurred, leading to a bullish recovery up to 1.3691, indicating a shift in momentum. Following this move, the price entered a consolidation phase, moving sideways within a defined range as buying pressure began to stabilize. A brief breakout attempt above the range failed to sustain, with price returning back inside the channel. The current price is trading around 1.3672, approaching the lower boundary of the range, suggesting the market is testing a key support area within the consolidation structure.
From a technical perspective, Bollinger Bands are beginning to contract, reflecting decreasing volatility and a transition into a consolidation phase after the prior impulsive movements. Price is currently trading near the middle-to-lower band, indicating a lack of strong directional momentum and a balance between buyers and sellers. The MFI (14) is around 42.80, suggesting neutral-to-slightly bearish money flow, with no strong accumulation or distribution signal dominating the market. Meanwhile, the Stochastic Oscillator (5,3,3) is moving in the lower range around 27.78 / 37.97, indicating that price is approaching oversold territory, which could support a potential short-term bounce if buying pressure re-enters the market.
Recent developments across Canada, the United States, and the global economy reflect a mix of resilience and caution, with the Bank of Canada holding interest rates steady while managing inflation and weak exports, alongside new fiscal initiatives to support long-term growth. In the U.S., the economy remains relatively strong with growth projected above trend, supported by consumer spending, though risks persist from elevated oil prices and geopolitical tensions. These combined factors have contributed to USDCADs heightened volatility over the past week, with the pair now showing signs of sideways consolidation as markets await clearer direction.
Technical Market Overview
1. Current Position: USDCAD is currently trading around 1.3672, moving within a horizontal consolidation range after a sharp bearish decline followed by a corrective bullish rebound. Price action reflects a neutral structure in the short term, with no clear higher high or lower low formation, indicating indecision as the market tests the lower boundary of the range.
2. Resistance Zone: Immediate resistance is located at 1.3691, which marks the upper boundary of the current consolidation range and a recent rejection point. A stronger resistance level is seen at 1.3713–1.3714, representing the previous swing high and a key supply zone where the earlier bearish move originated.
3. Support Zone: Nearest support is identified at 1.3666, aligning with the lower boundary of the current range where price is currently reacting. A deeper support zone lies around 1.3596, marking the recent swing low and the base of the bullish recovery, making it a critical structural support level.
4. Indicator Observation: Technical indicators suggest a consolidation phase with mild bearish pressure. Bollinger Bands are contracting, signaling reduced volatility and potential range-bound movement. The MFI (14) remains around 42.80, indicating neutral-to-weak capital inflow, while the Stochastic Oscillator (5,3,3) is approaching the oversold region, suggesting that downside momentum may be limited in the short term and a corrective bounce could occur.
5. Technical Summary: Overall, USDCAD is currently in a consolidation phase following a bearish move and subsequent recovery, with price hovering near support. The structure suggests a neutral-to-slightly bearish bias unless a strong reaction from the support level occurs. A confirmed break below 1.3666 could open further downside toward 1.3596, while a rebound from current levels may push price back toward the 1.3691 resistance zone, maintaining the range-bound structure.
Market Performance:
Forex Last Price % Change
EUR/USD 1.1680 +0.04%
USD/JPY 160.27 −0.10%
Today's Key Economic Calendar:
US: Fed Interest Rate Decision & Press Conference
CN: NBS Manufacturing & Non-Manufacturing PMI
CN: RD Manufacturing PMI
JP: Consumer Confidence
DE: GDP Growth Rate QoQ & YoY Flash
EU: Inflation Rate MoM & YoY Flash
UK: BoE Interest Rate Decision
UK: BoE Monetary Policy Report
EU: Deposit Facility Rate
EU: ECB Interest Rate Decision
US: Core PCE Price Index MoM
EU: ECB Press Conference
EU: ECB President Lagarde Speech
Risk Disclaimer: This report is for informational purposes only and does not constitute financial advice. Investments involve risks, and past performance does not guarantee future results. Consult your financial advisor for personalized investment strategies.
ڈس کلیمر:
یہ مضمون صرف مصنف کی ذاتی رائے پر مبنی ہے، یہ پلیٹ فارم کی سرمایہ کاری کی مشورہ نہیں ہے۔ پلیٹ فارم مضمون کی معلومات کی درستگی، مکملیت اور بروقت ہونے کی کوئی ضمانت نہیں دیتا، اور مضمون کی معلومات پر اعتماد یا استعمال سے ہونے والے کسی بھی نقصان کی ذمہ داری قبول نہیں کرتا۔
WIKIFX بروکر
ایکسچینج ریٹ کا حساب
USD

CNY
موجودہ ایکسچینج ریٹ:0
براہ کرم رقم درج کریں۔
USD
تبادلہ کے قابل رقم
CNY
حساب شروع کریں 