
US Dollar Technical Outlook Versus PHP, SGD, MYR and INR Bearish?
Abstract:Will the US Dollar see near-term losses against the Philippine Peso, Singapore Dollar and Malaysian Ringgit? Technical signals seem to point in that direction as FOMC minutes near.
USD/PHP, USD/SGD, USD/MYR, USD/INR Talking Points
US Dollar at risk to losing upside momentum versus ASEAN FX in near-term
Philippine Peso, Singapore Dollar and Malaysian Ringgit eyeing breakouts
USD/INR uptrend faces its next critical psychological barrier, will it hold?
USD/PHP Technical Outlook
The Philippine Peso may find itself outperforming against the US Dollar as it looks to confirm a Bearish Engulfing candlestick pattern. USD/PHP is on the verge of extending losses under the near-term rising trend line from the beginning of August. That places the focus on support at 51.86. Otherwise, a false breakout may result in uptrend resumption towards 52.73.Fundamentally, FOMC minutes may boost USD.
USD/PHP Daily Chart
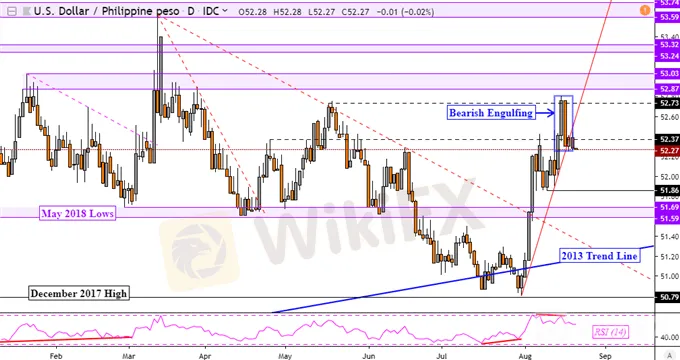
USD/PHP Chart Created in TradingView
USD/SGD Technical Outlook
The US Dollar is looking increasingly vulnerable to the Singapore Dollar after USD/SGD formed an Evening Star bearish reversal pattern. This followed fading upside momentum noted last week, with the currency pair now looking to confirm closes under the rising support line from the middle of July. Further declines under support, which is a range between 1.3808 and 1.3836, opens the door to reversal confirmation.
USD/SGD Daily Chart

USD/SGD Chart Created in TradingView
USD/MYR Technical Outlook
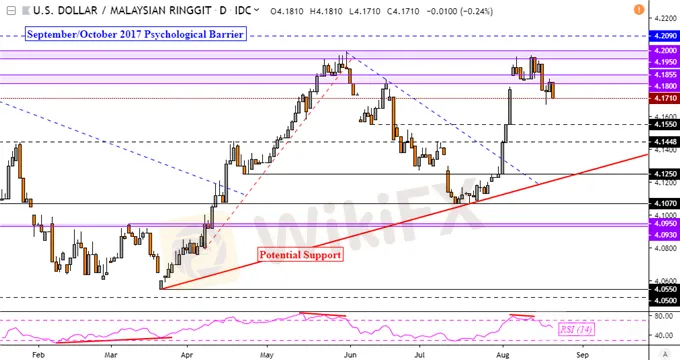
Meanwhile, the US Dollar is also at risk to the Malaysian Ringgit after USD/MYR confirms a close under support at 4.1800. That opens the door to a reversal of the near-term uptrend from the middle of July. In the medium-term, the currency pair may test potential rising support from March (red line below). Along the way stands areas of support around 4.1550 and 4.1448.
USD/MYR Daily Chart
USD/INR Technical Outlook
Focusing on the Indian Rupee, the US Dollar has managed to extend gains despite fading upside momentum. This is represented as negative RSI divergence on the chart below. This comes as USD/INR faces the next critical psychological barrier between 71.53 and 71.82 after the break above descending resistance – from October 2018. If resistance holds, a turn lower places support at 70.88. Otherwise, a climb eyes 72.55.
USD/INR Daily Chart

USD/INR Chart Created in TradingView
FX Trading Resources
Disclaimer:
The views in this article only represent the author's personal views, and do not constitute investment advice on this platform. This platform does not guarantee the accuracy, completeness and timeliness of the information in the article, and will not be liable for any loss caused by the use of or reliance on the information in the article.
Read more

Explaining Candlestick Charts For Newbies
New to candlestick charts? Our comprehensive guide will explain everything you need to know. Start trading smarter and more profitably today with Capitist!

Moody’s Analytics sees Malaysia’s economy rebounding in Q4
Malaysia’s fourth-quarter growth is expected to rebound on the back of a strong export performance, as well as a pick-up in private consumption as borders reopen, Moody’s Analytics said.

Canadian Dollar Technical Analysis: Short-term CAD Weakness Anticipated–Setups for CAD/JPY, USD/CAD
While the BOC has turned more hawkish, other fundamental factors are working against the Canadian Dollar in the near-term. Volatility and weakness in oil prices coupled with a stretch of disappointing Canadian economic data are weighing on the Loonie. According to the IG Client Sentiment Index, USD/CAD rates have a bullish bias in the near-term.

NZD/USD Gyrates at Support as Economic Strength Bolsters RBNZ Rate Hike Bets
APAC traders look to close the week out on a bright note following Wall Street rebound. RBNZ rate hike bets continue to strengthen as economy recovers from Covid lockdowns. And, NZD/USD clings to 100-day Simple Moving Average (SMA) after overnight drop.
WikiFX Broker
Latest News
Caution in Online Trading: Intersphere Enterprises Alleged Scam
Breaking: Orfinex defrauded $40,000.
True Forex Funds Comes Back with New Trading Technology
Binance in Legal Crosshairs: Ontario Court Gives Nod to Class Action
Ocean Markets Review: Unregulated Trading Platform Analysis
CySEC Added 12 Firms into its New Warning List
FXORO Penalized €360K by CySEC for Investment Law Breaches
Leverate Losses ICF Membership & CIF Authorization
FCA exposed a clone firm
Crypto.com Faces Regulatory Issues with South Korea's Launch
Currency Calculator

