
GBPUSD Price: Riding the US Dollar Slump, US CPI Ahead
Abstract:GBPUSD is benefitting from further weakness in the US dollar and is pushing back to levels last seen three-weeks ago.
Sterling (GBP) Price, Chart and Analysis
GBPUSD may break back above 1.2800 in the short-term.
The US dollar short-term price action predicated on upcoming US CPI data.
Q2 2019 GBP and USD Forecasts andTop Trading Opportunities
GBPUSD Riding US Dollar Weakness
Sterling is currently trading around 1.2730 against the US dollar and nearing highs seen around three-weeks ago. Sterling as a currency remains flat-to-weak, while the US dollar strength continues to fade as US interest rate cuts become priced into the market. Over the year, US interest rate expectations have changed course sharply from the market pricing in two/three 0.25% rate hikes to now pricing in at least two 0.25% rate cuts. The latest look at US price pressures this afternoon will dictate the next short-term move in the greenback with CPI expected to edge 0.1% lower to 1.9% in May.
The US dollar basket (DXY) has now broken, and closed, below the 200-day moving average, a further negative sign for the greenback. Short-term bearish momentum may be contained as DXY remains in oversold territory.
US Dollar Basket (DXY) Daily Price Chart (October 2018 – June 12, 2019)
Sterling remains weak and is fully expected to remain that way as the process of choosing a new Conservative leader/Prime Minister continues. Brexit remains the candidates main battle ground with Remain candidates attacking PM favorite Boris Johnson over his plans to elave the EU on October 31, whatever the state of negotiations. The opposition Labour Party, and Conservative rebels, this afternoon are expected to launch an attempt to block a No-Deal Brexit by giving MPs control of the process.
Sterling Weekly Forecast: GBPUSD Price Rallies to a 2-Week High.
IG Client Sentiment data paints a negative picture for the pair with 75.3% of traders long GBPUSD, a bearish contrarian bias signal. However, recent daily and weekly positional changes suggest that GBPUSD may soon reverse higher.
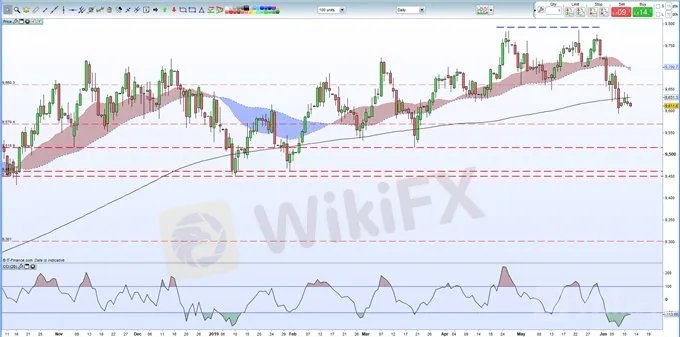
GBPUSD is eyeing 1.2765, a near one-month high, with little resistance in the way of the move. After here, the May 21 spike high at 1.2815 comes into play, ahead of the 23.6% Fibonacci retracement level at 1.2894 and the 200-day moving average at 1.2920. The CCI indicator is suggesting that the recent short-term move higher may be getting overstretched.
GBPUSD Daily Price Chart (October 2018 – June 12, 2019)

Traders may be interested in two of our trading guides – Traits of Successful Traders and Top Trading Lessons – while technical analysts are likely to be interested in our latest Elliott Wave Guide.
What is your view on GBPUSD – bullish or bearish? You can let us know via the form at the end of this piece or you can contact the author at nicholas.cawley@ig.comor via Twitter @nickcawley1.
Disclaimer:
The views in this article only represent the author's personal views, and do not constitute investment advice on this platform. This platform does not guarantee the accuracy, completeness and timeliness of the information in the article, and will not be liable for any loss caused by the use of or reliance on the information in the article.
Read more

Japanese Yen Caught Out on Fed Hawkishness and Omicron. Will USD/JPY Break?
The Japanese Yen weakened on Fed Chair Powell confirmed hawkishness. APAC equities were mixed, and crude oil remains mired before OPEC+. Omicron universal uncertainty continues. Will USD/JPY gain traction?

US Dollar Leaps on Fed Re-Nomination Pumping Up Treasury Yields. Will USD Keep Going?
The US Dollar rode higher as US yields rose across the curve. Crude oil prices recovered after OPEC+ threw a curve ball. With Thanksgiving almost here, where will USD go on holiday?

Euro (EUR) Price Outlook: No End Yet in Sight for EUR/USD Weakness
EUR/USD continues to tumble, with no sign yet of a rally or even a near-term bounce.. The pair has dropped already beneath the support line of a downward-sloping channel in place since late May this year to its lowest level since July 2020 and there is now little support between here and 1.1170. From a fundamental perspective, the Euro is suffering from a continued insistence by the European Central Bank that much higher Eurozone interest rates are not needed.

Dollar Index (DXY) Soars on Data and Hawkish Fed Lifting Yields. Can USD Fly Higher?
The US Dollar continues to break new ground as momentum gathers. Encouraging economic data and hawkish comments boost yields and USD. Commodities and currencies weaken against the Dollar. Will USD keep going?
WikiFX Broker
Latest News
CySEC withdraws license of Forex broker AAA Trade
Finalto Elevates OTC Trading With FSCA-Approved Liquidity
Ringgit Weakens Amidst Battling Global Economic Turmoil
WikiFX Broker Assessment Series | Oroku Edge: Is It Trustworthy?
DESPITE A SHARP FALL IN FX, FOOD COSTS CONTINUE TO RISE.
Complaint against Capitalix
Binance Elevates Dubai's Crypto Status with Full VASP License
Webull Canada Unveils Desktop Trading Platform
Alert: Beware Of Unlicensed Scam Trading Broker ProMarkets
As Soaring Gold Prices Spark Enthusiasm,WikiFX Helps You Avoid Illegal Platforms’ Traps
Currency Calculator

