NZD/USD Price Analysis: Consolidates in a narrowing price range
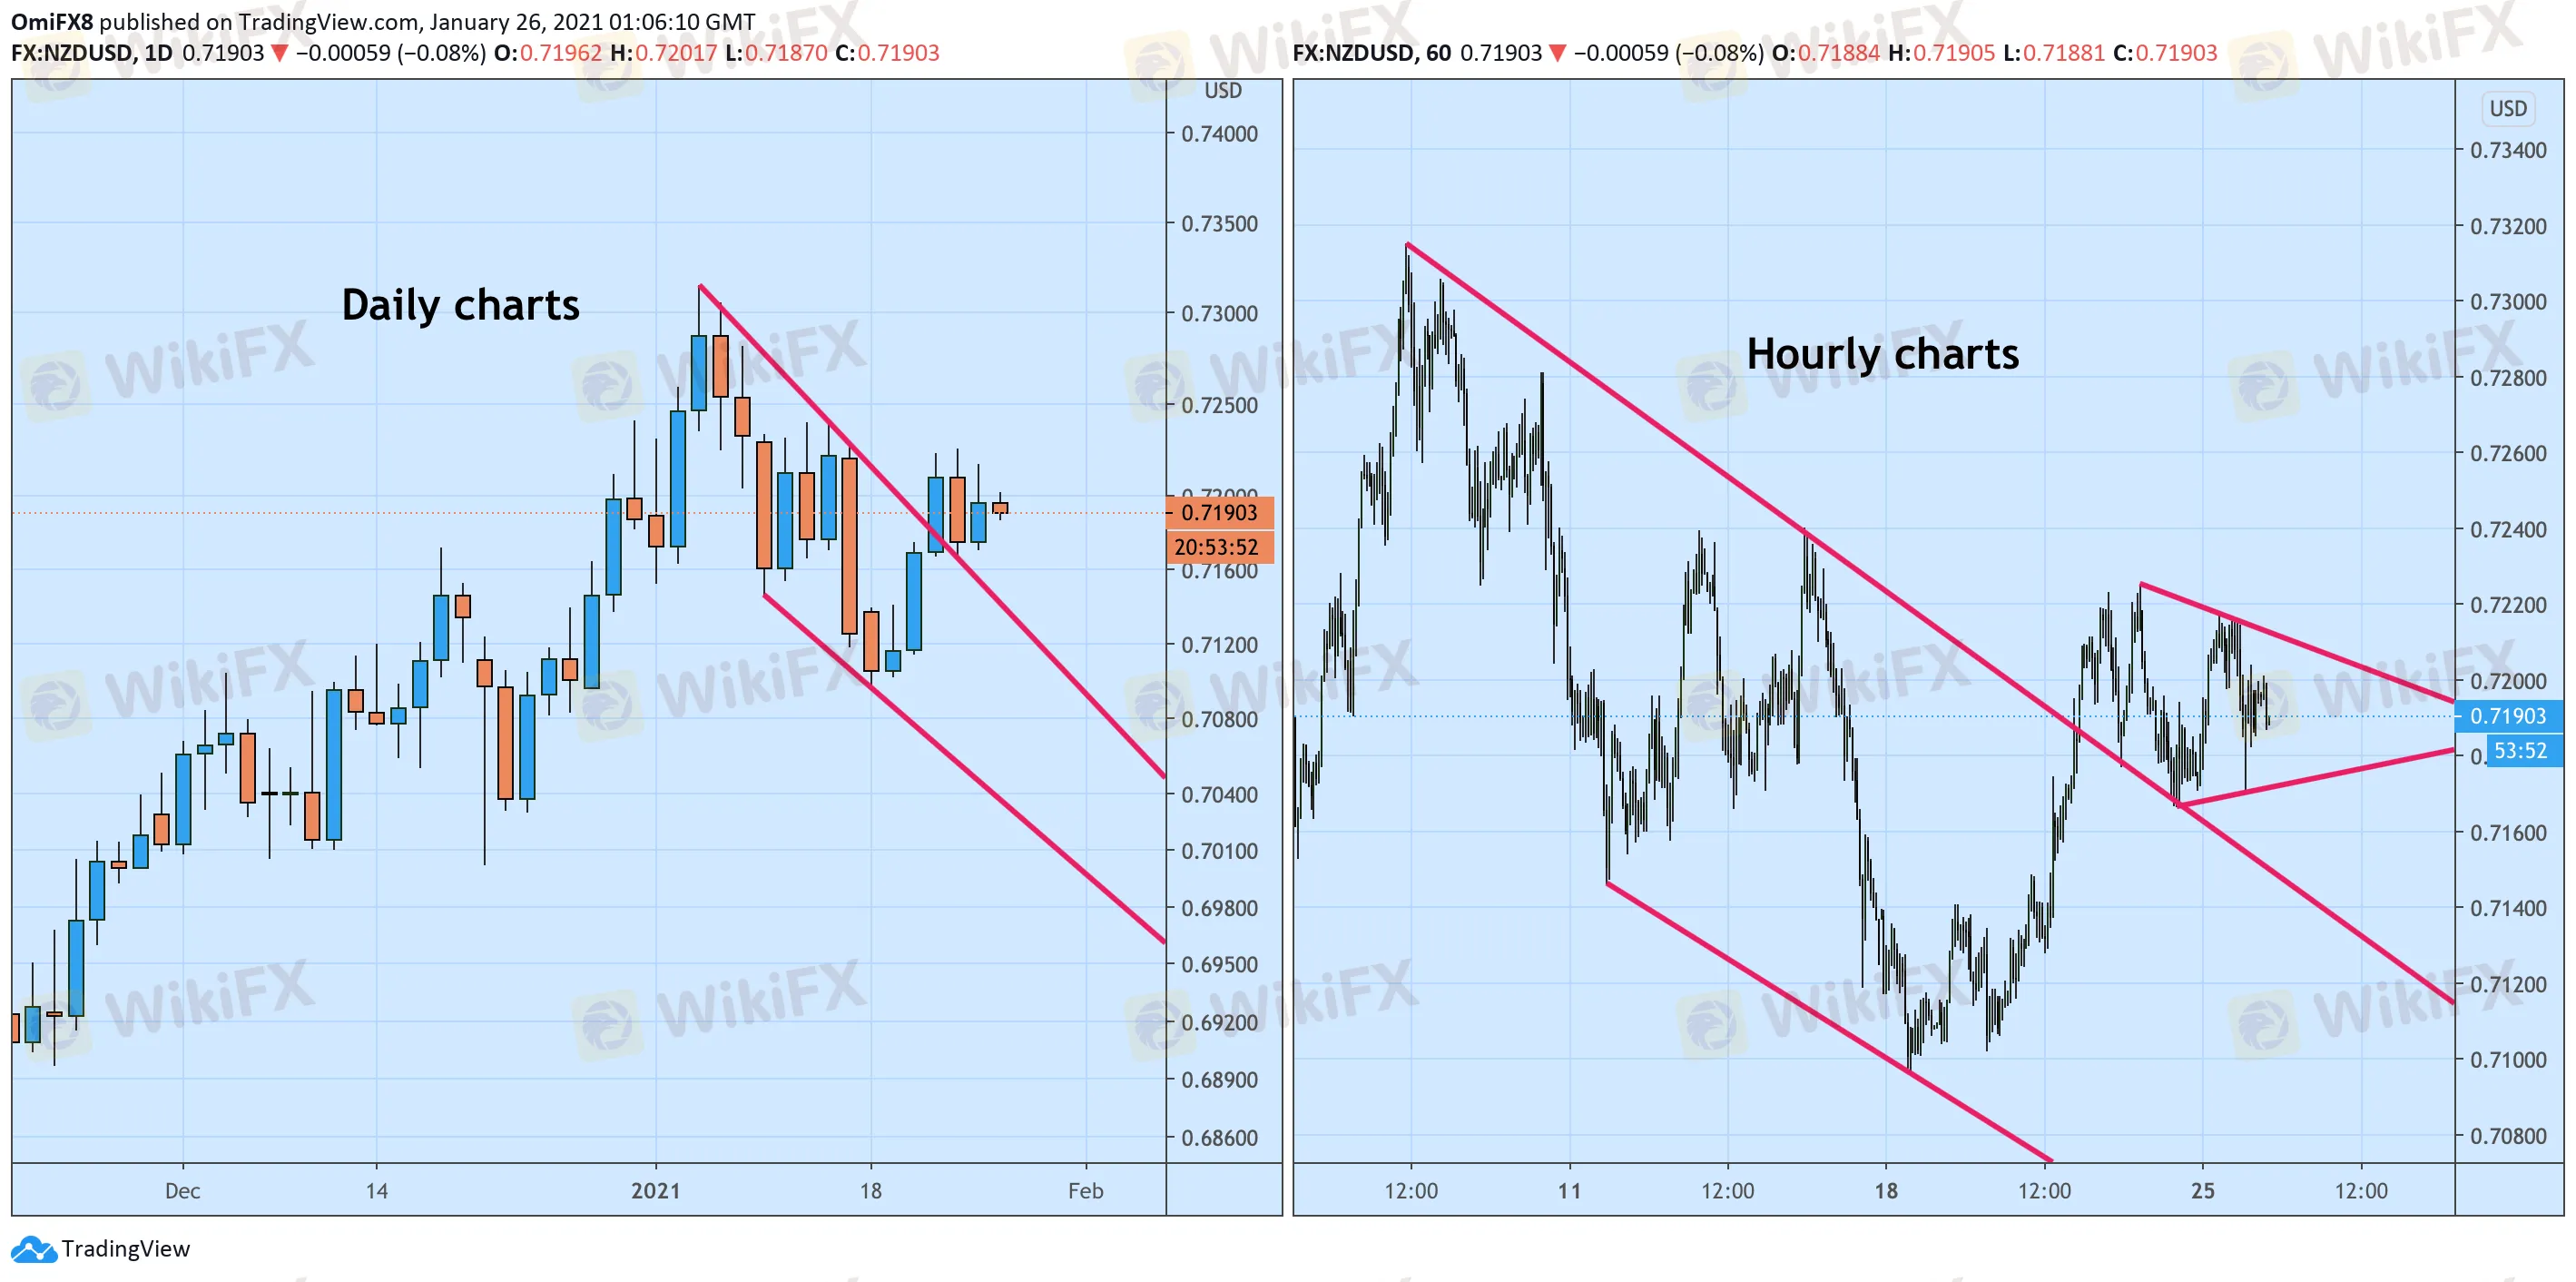
Abstract:NZD/USD's hourly chart shows a contracting triangle pattern. A breakout would validate the bullish pattern seen on the daily chart.
NZD/USD has created a narrowing price range over the past 48 hours or so, marking a weak follow-through to a bullish falling channel breakout confirmed by Thursday's 0.51% gain.
The immediate bias will remain neutral as long as the pair is trapped in the contracting triangle (narrowing price range) seen on the hourly chart. A move above the top end of the triangle, currently at 0.7212, would validate the daily chart falling channel breakout confirmed last week and open the doors for a re-test of the Jan. 6 high of 0.7315.
Alternatively, a range breakdown would shift risk in favor of a drop to the Jan. 18 low of 0.7096.
Disclaimer:
The views in this article only represent the author's personal views, and do not constitute investment advice on this platform. This platform does not guarantee the accuracy, completeness and timeliness of the information in the article, and will not be liable for any loss caused by the use of or reliance on the information in the article.
WikiFX Broker
Latest News
End of USD Dominance Amid Escalating Geopolitical Risks
EXPERTS SAY NIGERIA CAN INCREASE FOREIGN EXCHANGE REMITTANCES BY LOWERING TRANSACTION COSTS.
WikiFX Forex Rights Protection Day has received extensive attention!
Caution in Online Trading: Intersphere Enterprises Alleged Scam
Breaking: Orfinex defrauded $40,000.
True Forex Funds Comes Back with New Trading Technology
Binance in Legal Crosshairs: Ontario Court Gives Nod to Class Action
Ocean Markets Review: Unregulated Trading Platform Analysis
CySEC Added 12 Firms into its New Warning List
CLONE FIRM ALERT
Currency Calculator

