How to Use Past Price for Estimating the Next Step
Zusammenfassung:How Forex traders can use the charts as a road map to figure out the most likely price path?
How Forex traders can use the charts as a road map to figure out the most likely price path?
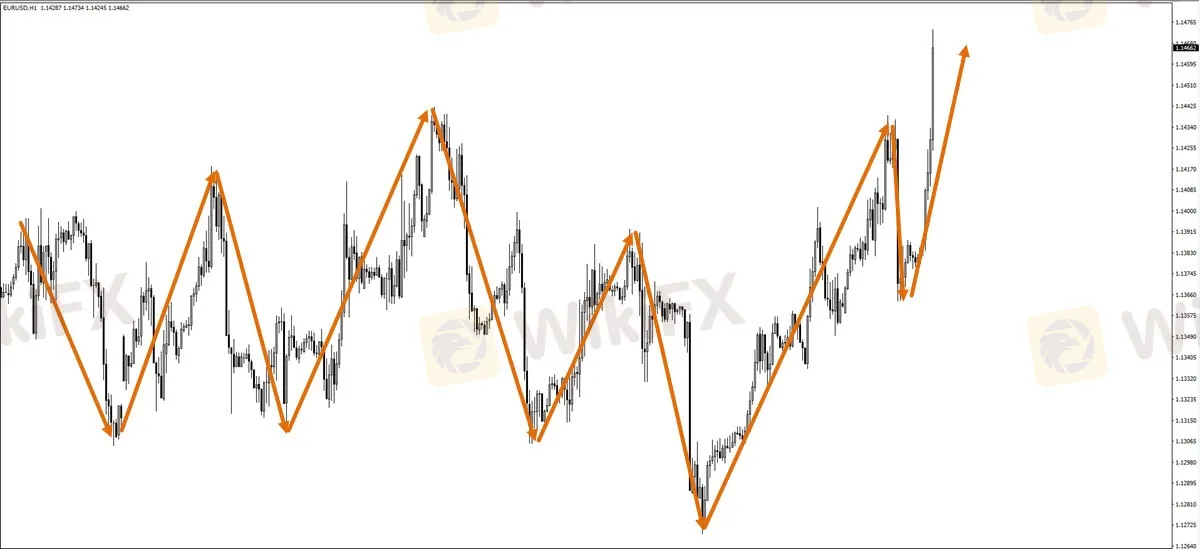
Supply and demand leaves a trail on the chart (past price). Traders can analyse that trail (price movement) and use it as a road map to understand what the next price movement could be. Analysing past price (past path of least resistance) helps traders estimate and forecast what the next step or two could be. Based on that, traders can then assess whether there are any interesting potential trade setups within that expected path.
The financial markets in general and the Forex market in specific are in a continuous tug of war between sellers and buyers (supply and demand). This creates price waves that are visible on almost all charts.
Haftungsausschluss:
Die Ansichten in diesem Artikel stellen nur die persönlichen Ansichten des Autors dar und stellen keine Anlageberatung der Plattform dar. Diese Plattform übernimmt keine Garantie für die Richtigkeit, Vollständigkeit und Aktualität der Artikelinformationen und haftet auch nicht für Verluste, die durch die Nutzung oder das Vertrauen der Artikelinformationen verursacht werden.
WikiFX-Broker
WikiFX-Broker
Aktuelle Nachrichten
Dogwifhat-Preis steigt um 5% vor möglichem Coinbase-Effekt
XRP konsolidiert den sechsten Tag in Folge um die wichtige Marke von $0,50
Diese Kupfermine in Panama liegt still – und ist mit der Grund, warum der Preis des Rohstoffs weltweit in die Höhe schnellt
Bitcoin hat in diesem Jahr 50 Prozent an Wert gewonnen – geht das so weiter?
OMNI mit fast 50% Verlust nach Airdrop und Börsengang
Zugreifen? Diese 8 Luxusuhr-Marken sind im Preis gefallen
Maschmeyer-Startup sammelt über 50 Millionen Euro ein – hier seht ihr das Pitchdeck
Rekord: Deutsche haben 7716 Milliarden Euro – fast die Hälfte davon liegt auf dem Konto
Warum sich Kryptowährungen kurz vor oder kurz nach der Bitcoin-Halbierung erholen könnten
Ripple steht vor erheblichen Korrekturen, da der ehemalige SEC-Anwalt sagt, dass die Klage bis zum Obersten Gerichtshof gehen könnte
Wechselkursberechnung

