简体中文
繁體中文
English
Pусский
日本語
ภาษาไทย
Tiếng Việt
Bahasa Indonesia
Español
हिन्दी
Filippiiniläinen
Français
Deutsch
Português
Türkçe
한국어
العربية
WIKIFX REPORT: Will Amadeus IT Stock Make Another Push Higher?
Abstract:Looking at the technical picture of the Amadeus IT Group SA (BME: AMS) stock on our 4-hour chart we can see that as of yesterday, the share price managed to overcome a short-term tentative downside resistance line taken from the high of May 30th. For now, AMS continues to trade above that line, meaning that more byers might see it as a good sign to step in. We will take a positive approach for now.
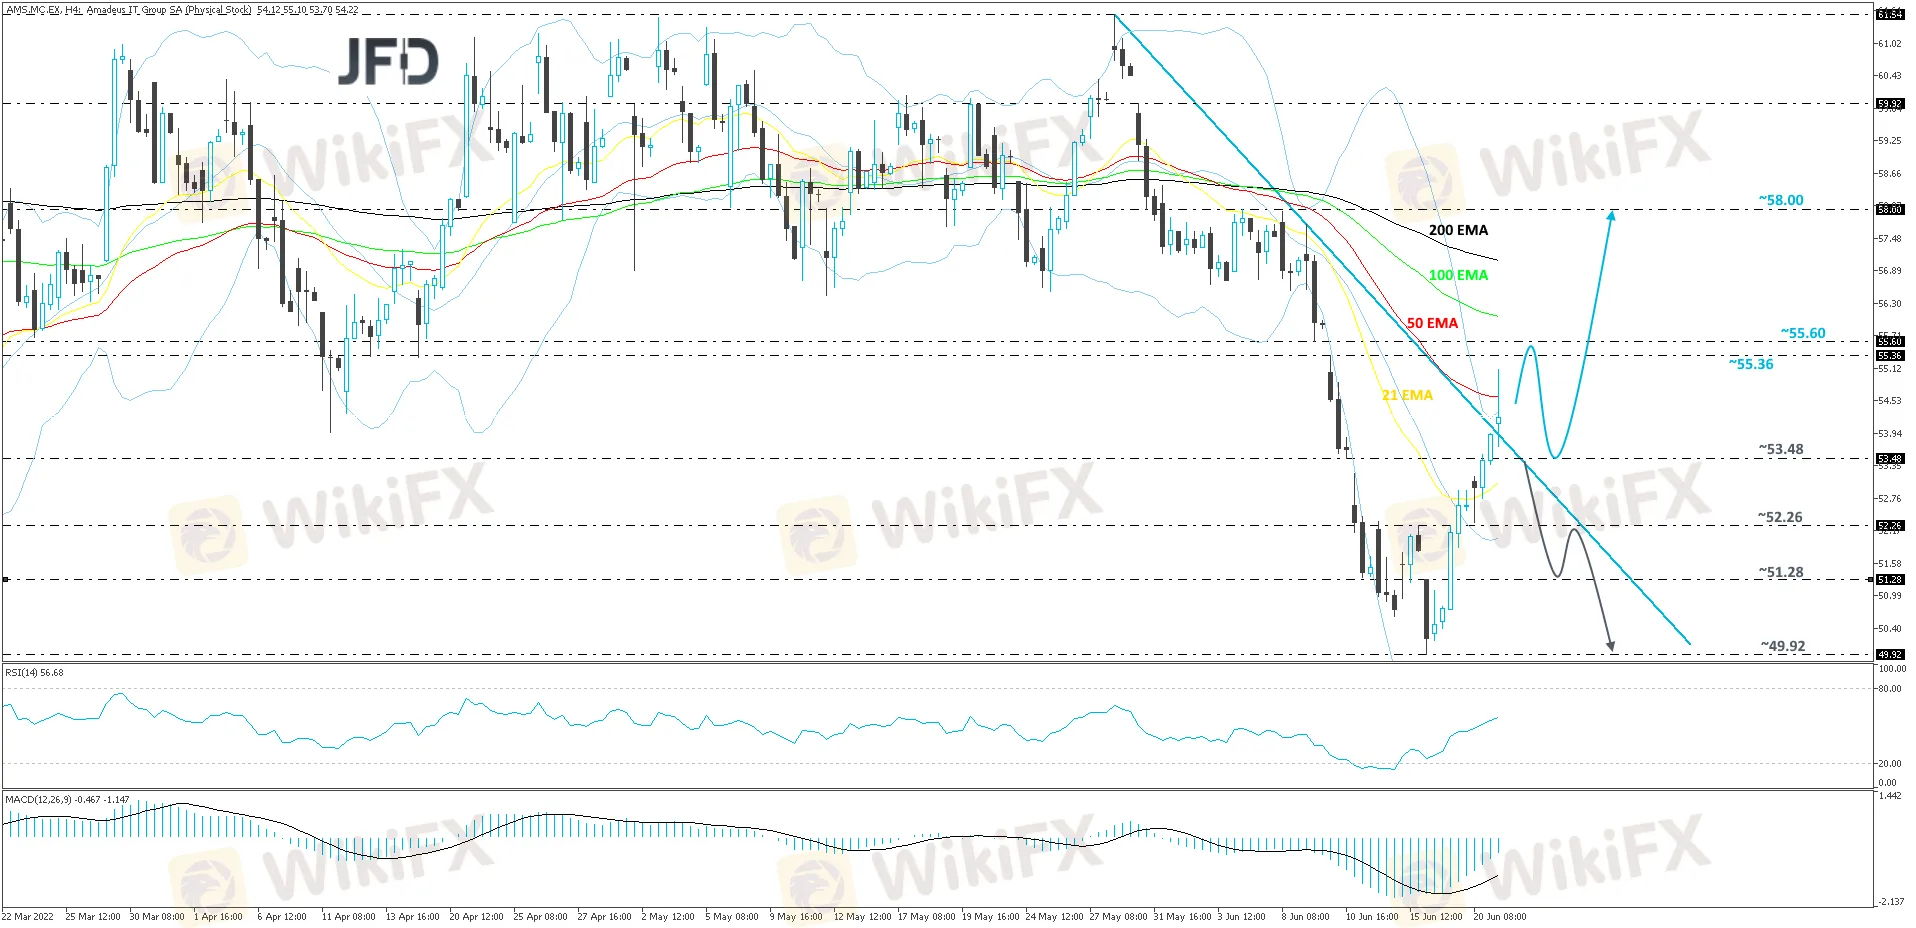
Looking at the technical picture of the Amadeus IT Group SA (BME: AMS) stock on our 4-hour chart we can see that as of yesterday, the share price managed to overcome a short-term tentative downside resistance line taken from the high of May 30th. For now, AMS continues to trade above that line, meaning that more byers might see it as a good sign to step in. We will take a positive approach for now.
A further push north may bring the price to its next potential resistance area between the 55.36 and 55.60 levels, marked by the high of June 10th and the low of June 9th respectively. Initially, AMS could stall there for a bit, or even correct slightly lower. However, if the stock is able to stay somewhere above the aforementioned downside line, another move higher might be possible. If this time the price can overcome the previously mentioned resistance area, this may open the door for a move towards higher hurdles, where the next one could be at 58.00, marked by the high of June 6th.
The RSI and the MACD are pointing higher. Additionally, the RSI is above 50, showing positive price momentum. However, the MACD is above the signal line, but remains below zero, while slowly grinding towards it. Both indicators are pointing upwards, however, to get more positive with higher areas, a break above 55.60 would be needed.
Alternatively, a price-drop back below the previously mentioned downside line and below the 53.48 zone, marked by the low of June 10th, could temporarily scare off some buyers from the arena. AMS may then fall to the 52.26 obstacle, or to the 51.28 hurdle, marked by the inside swing high of June 16th. If the buyers are still nowhere to be found, the stock might slide again and the next target could be at 49.92, marked by the low of June 16th.
Disclaimer:
The views in this article only represent the author's personal views, and do not constitute investment advice on this platform. This platform does not guarantee the accuracy, completeness and timeliness of the information in the article, and will not be liable for any loss caused by the use of or reliance on the information in the article.
Read more

Nigerian Senate Backs Crypto Regulation to Strengthen Naira
Meta Description: The Nigerian Senate supports cryptocurrency regulation to safeguard investors and strengthen the naira amid inconsistent policies. This move aims to boost economic stability and attract investments.

The Role of Forex Brokers Explained
The foreign exchange market, commonly known as forex, stands as the world's largest financial arena, boasting daily trading volumes in the trillions of dollars. For those eager to capitalize on currency fluctuations, entering this dynamic yet intricate market necessitates the guidance of a skilled intermediary: the forex broker.

SC Malaysia Warned Against Arab Investment Company
SC Malaysia has been cautioned regarding Arab investment company. According to the Authority, a possible clone operating an illegal investment scheme offers high returns e.g.a return of RM3,000 in 24 hours with an investment of RM300. This entity does not carry a License.

A South African Trader Claimed That SWIFT EARNERS Blocks His Withdrawal Request
SWIFT EARNERS has emerged as a controversial and highly dubious player. Despite its claims of being a reliable broker with a base in the United States and additional operations in Thailand, the experiences of numerous victims tell a different story. A particularly harrowing account comes from a South African victim who has found himself ensnared in what appears to be a well-orchestrated scam.
WikiFX Broker
Latest News
A South African Trader Claimed That SWIFT EARNERS Blocks His Withdrawal Request
SC Malaysia Warned Against Arab Investment Company
Nigerian Senate Backs Crypto Regulation to Strengthen Naira
The Role of Forex Brokers Explained
Currency Calculator

