
FX4152708566 交易者
2021-05-17 08:28 發表於 
這些Acy圖表是否經過驗證可以操縱,還是Acy犯了一個錯誤?
下面是4小時圖表上Acy數據的快照。“ 4小時圖表上的2小時柱。”兩者之間的價格差距從不以任何方式與任何較小的時間框架圖匹配。 Acy說這是正常現象。誰曾在4小時圖表上聽到過2小時柱線。仔細檢查后,圖表中會同時顯示2個不同的價格,而15個圖表上的這些價格存在2到4小時的時滯我覺得這表明Acy已被操縱以操縱價格,也被Acy通過改變平臺上的某些東西阻止了我使用經過驗證的高端Ea。使用這些ea,我賺了很多錢。突然之間,EA被拒絕訪問該平臺,Acy從一開始就完全忽略了我,Acy在購買Synergy FX時也購買了我的交易。價值約4萬美元。現在我失去了很多。請查看下面的圖表。 15分鐘圖表涵蓋了4小時圖表上2小時柱的兩個時間范圍。

以下為原文推薦
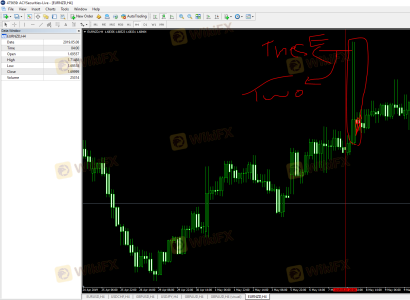
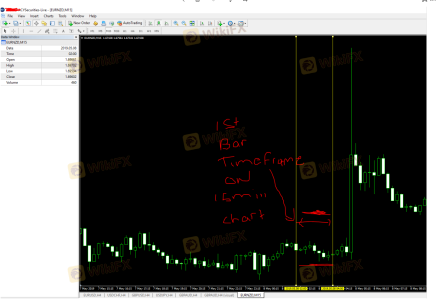
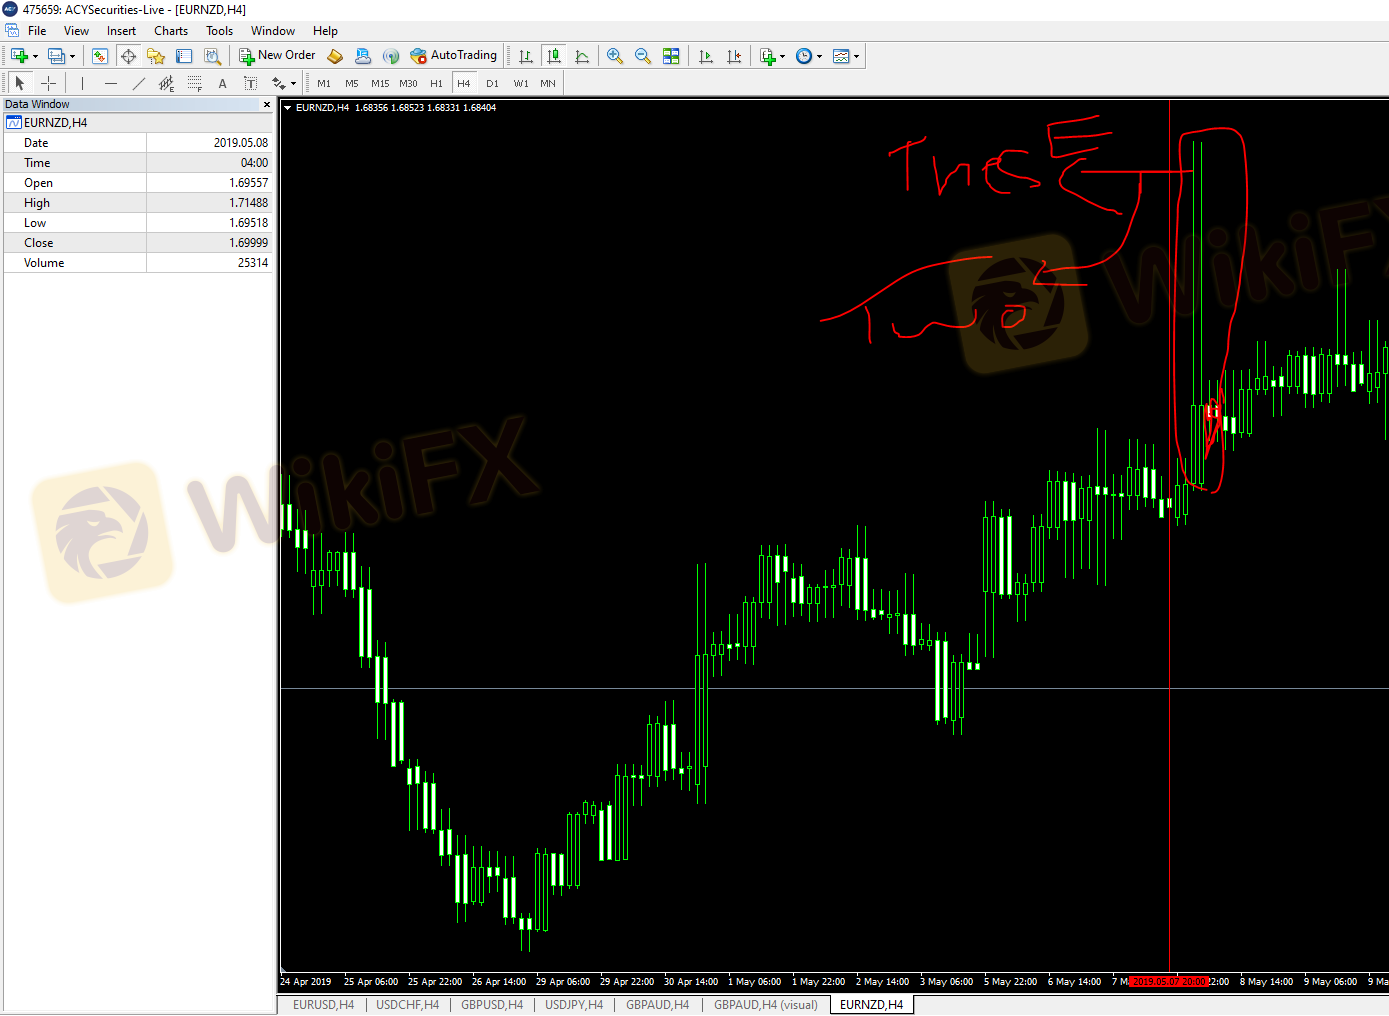
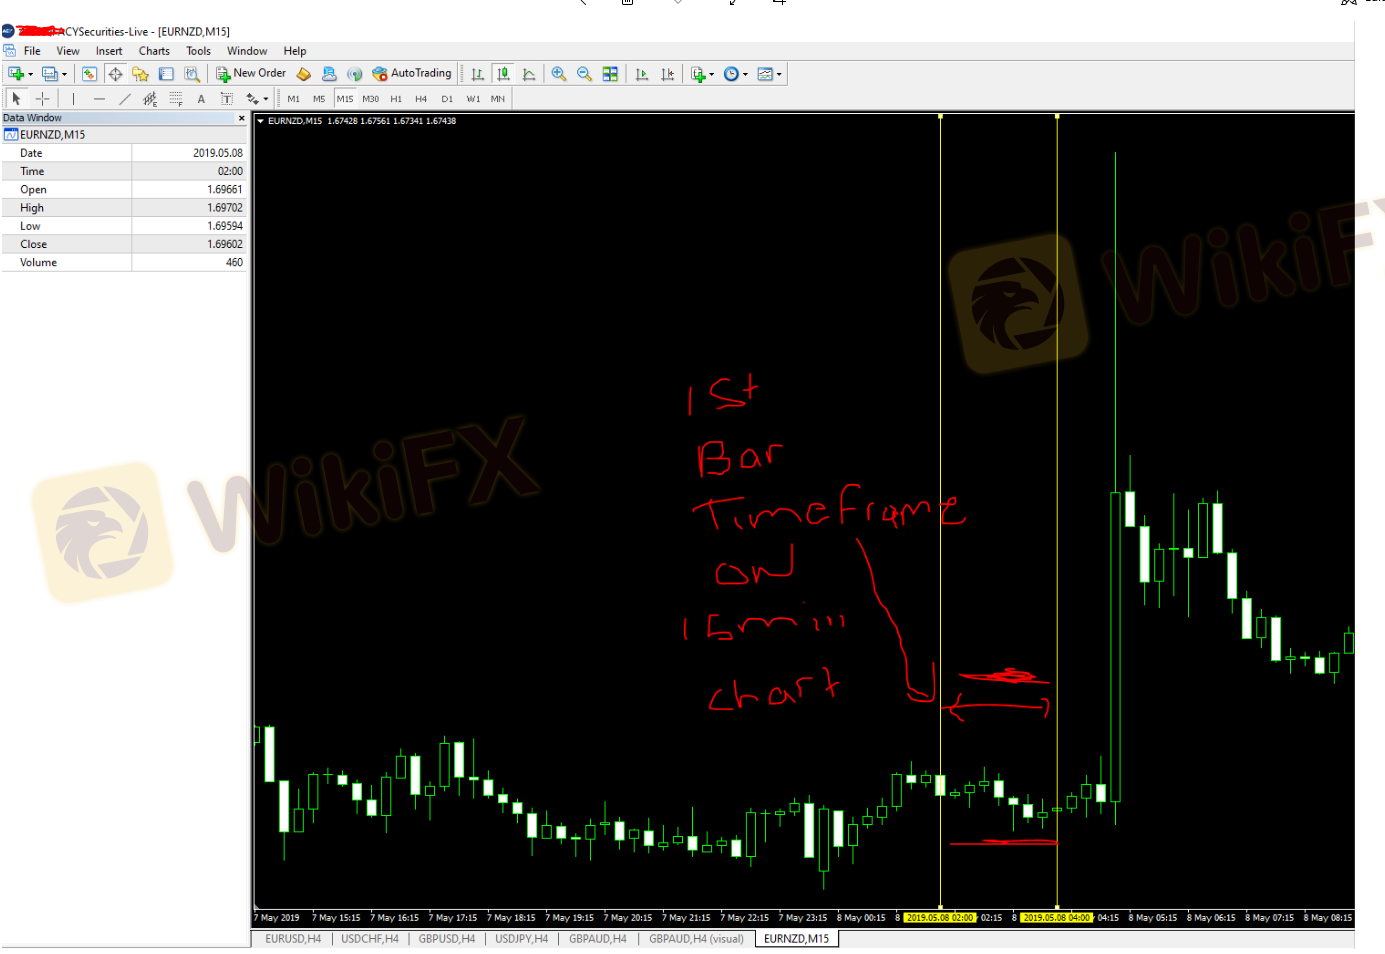
Does These Acy Charts Proven Manipulation Or Have Acy Just Made A Mistake?
Below is a shot of Acy's data on a 4hour chart." 2 hour bars on a 4 hour chart." REALLYI bar of the two never matches up to any smaller timeframes chart for price in any way. Acy SAY THIS IS NORMAL.Who has ever heard of 2 hour bars on a 4 hour chart anyway.With closer examination it shows 2 different prices happening in the charts at once ,with a 2 to 4hour time lag in these different prices on the 15 min chart.I feel this shows that Acy have been caught manipulating prices red handed.Also Acy have stopped me using proven high end Ea's by changing something in their platform. I was making good money using these ea's. Then all of a sudden the Ea's were denied access to the platform.I have been totally ignored from the start by Acy.Acy also bought my trades when they purchased Synergy FX. Around $40 k worth. Now I have lost the lot. Please look at the charts below.
The 15 minute chart cover both timeframes of the 2 hour bars on a four hour chart.
 加拿大
加拿大